SLIDE 8 |
faculty of economics and business centre for energy economics research
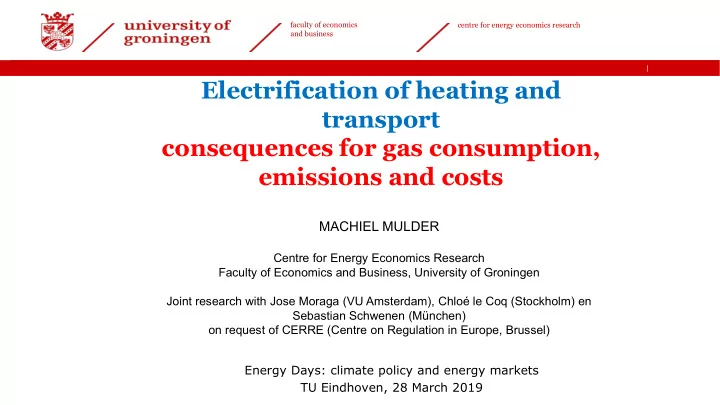
Variable Value Number of (x million) passenger cars 8,9 vans 0,84 trucks 0,15 buses 0,01 motorbikes and scooters 1,15 bicycles 22,7 Of which electric (x 1000) passenger cars 60 vans trucks buses 0,1 motorbikes and scooters bicycles 1500 Average distance per year (km) passenger cars 13022 vans 18896 trucks 59228 buses 61461 motorbikes and scooters 2000 bicycles 1000
Data and assumptions on road transport
Statistical data for 2016
Variable Value Passenger cars Annual number of new cars (x 1000) 400 Performance electric (kWh/100km) 20 Vans Annual number of new vans (x 1000) 60 Performance electric (kWh/100km) 35 Trucks Annual number of new trucks (x 1000) 10 Performance electric (kWh/100km) 70 Buses Annual number of new buses (x 1000) 0,75 Performance electric (kWh/100km) 100 Motorbikes and scooters Annual number of new M&S (x 1000) 75 Performance electric (kWh/100km) 5 Bicycles Annual number of new bicycles (x 1000) 1000 Performance electric (kWh/100km) 1 All vehicles Annual increase in number 1% Annual increase in efficiency 1% Annual increase in average distance per vehicle 0% Battery charging units Annual improvement in charging efficiency 0,5%
Assumptions on energy use for period to 2050