
SLIDE 1
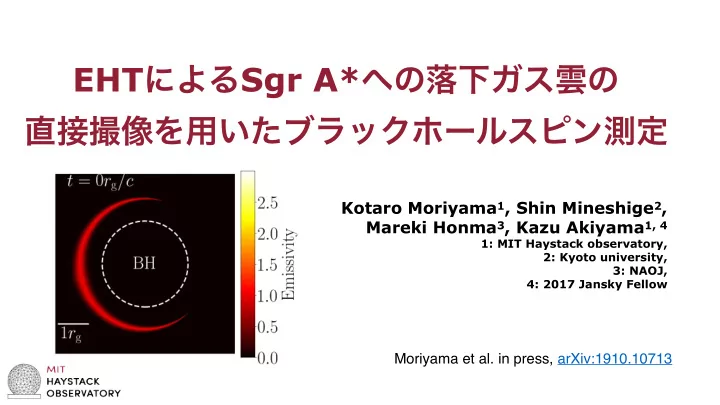
EHTによるSgr A*への落下ガス雲の 直接撮像を用いたブラックホールスピン測定
Kotaro Moriyama1, Shin Mineshige2, Mareki Honma3, Kazu Akiyama1, 4
1: MIT Haystack observatory, 2: Kyoto university, 3: NAOJ, 4: 2017 Jansky Fellow
Moriyama et al. in press, arXiv:1910.10713
EHT Sgr A* - - PowerPoint PPT Presentation
EHT Sgr A* Kotaro Moriyama 1 , Shin Mineshige 2 , Mareki Honma 3 , Kazu Akiyama 1, 4 1: MIT Haystack observatory, 2: Kyoto university,
1: MIT Haystack observatory, 2: Kyoto university, 3: NAOJ, 4: 2017 Jansky Fellow
Moriyama et al. in press, arXiv:1910.10713
32th Rironkon Symposium, 12/25, 2019, NAOJ Mitaka, Tokyo, Japan 2
(e.g., Ozel et al. 2010; Gravity Collaboration et al. 2018; EHT collaboration et al. 2019)
(e.g., Abbott et al. 2017; Broderick et al. 2016; EHT collaboration et al. 2019)
Goal: Observational proof of the black hole spacetime to test of general relativity theory
EHT collaboration et al. (2019)
32th Rironkon Symposium, 12/25, 2019, NAOJ Mitaka, Tokyo, Japan
3
Credit: H. Shiokawa
Quantities Sgr A* M87* Black hole mass [M] 4 × 10⁶ 6.5 × 10⁹ Distance [kpc] 8 1.68 × 10⁴ Apparent size [µas] 50 40 Period at ISCO (a/M = 0) 31 min 37 day
(e.g., Gravity Collaboration et al. 2018; EHT collaboration et al. 2019)
Advantages:
・Largest apparent diameter among all black hole candidates (~50 μas) ・Relativistic flux variation (~30 min-1hr) → Black hole spin indicator?
Lu et al. 2018
32th Rironkon Symposium, 12/25, 2019, NAOJ Mitaka, Tokyo, Japan
4
Observer
Innermost stable orbit (rms)
32th Rironkon Symposium, 12/25, 2019, NAOJ Mitaka, Tokyo, Japan
5
em
Distance from the central axis
Emissivity model
Thickness of the gas cloud (ring or arc) Photon frequency
νobs
relativistic effect
Radiation transfer equation
photon index
32th Rironkon Symposium, 12/25, 2019, NAOJ Mitaka, Tokyo, Japan
6
rg = GM/c2
32th Rironkon Symposium, 12/25, 2019, NAOJ Mitaka, Tokyo, Japan
7
Simulated movie
rg/c = 20 sec (SgrA*) = 0.4 day (M87*) rg = 5 μas (SgrA*) = 3.8 μas (M87*)
32th Rironkon Symposium, 12/25, 2019, NAOJ Mitaka, Tokyo, Japan
8
rg/c = 20sec (SgrA*) = 0.5day (M87) rg = 5μas (SgrA*) = 3.8μas (M87)
32th Rironkon Symposium, 12/25, 2019, NAOJ Mitaka, Tokyo, Japan
9
ct/rg
Normalized flux (a) Total (Ring) Direct (arc) Secondary
ct/rg (b) φ0/π = 0.0 φ0/π = 0.5 φ0/π = 1.0 φ0/π = 1.5
ct/rg (c) φ0/π = 0.0 φ0/π = 0.5 φ0/π = 1.0 φ0/π = 1.5
32th Rironkon Symposium, 12/25, 2019, NAOJ Mitaka, Tokyo, Japan
10
Moriyama et al. in press
i=75°
32th Rironkon Symposium, 12/25, 2019, NAOJ Mitaka, Tokyo, Japan
11
Thickness Spectrum index Arc-chord angle Viewing angle Infalling velocity Rotation velocity
a/M=0.9 i=75°
32th Rironkon Symposium, 12/25, 2019, NAOJ Mitaka, Tokyo, Japan
12
(u, v) coverage for SgrA*
Expected EHT in 2017-2020
Gas clouds with various initial parameters
(initial velocities are based on GRMHD/RIAF )
rg/c = 20 sec (SgrA*) = 0.4 day (M87*) rg = 5 μas (SgrA*) = 3.8 μas (M87*)
Moriyama et al. in press
32th Rironkon Symposium, 12/25, 2019, NAOJ Mitaka, Tokyo, Japan
13
Baseline: ALMA/APEX-JCMT/SMA
a/M = 0.9, viewing angle = 75∘ inner edge of the disk = rISCO
Synthetic light curve
Align by maximum peaks
Superposed light curve
Moriyama et al. in press Unique dependence
32th Rironkon Symposium, 12/25, 2019, NAOJ Mitaka, Tokyo, Japan
14
Moriyama et al. in press
Table 3. Estimated spin value of each baseline baselines aest/M for atrue/M = 0.2 atrue/M = 0.6 atrue/M = 0.9 (1) (2) (3) (4) ALMA-JCMT/SMA 0.39 (0.10-0.66) 0.56 (0.33-0.77) 0.86 (0.82-0.90) ALMA-SMT 0.33 (-0.00-0.62) 0.56 (0.31-0.76) 0.87 (0.82-0.90) JCMT/SMA-SMT 0.34 (0.04-0.62) 0.62 (0.37-0.80) 0.89 (0.83-0.94) ALMA- PV 30 m 0.27 (-0.03-0.59) 0.57 (0.34-0.75) 0.86 (0.82-0.90) ALMA-LMT 0.30 (0.01-0.61) 0.55 (0.31-0.75) 0.86 (0.82-0.90) ALMA-SPT 0.31 (0.01-0.61) 0.54 (0.28-0.73) 0.86 (0.82-0.90) ALMA-NOEMA 0.31 (-0.01-0.62) 0.56 (0.34-0.76) 0.87 (0.82-0.90) LMT-JCMT/SMA 0.33 (0.02-0.63) 0.56 (0.34-0.74) 0.87 (0.84-0.92) LMT- PV 30 m 0.29 (-0.01-0.62) 0.56 (0.34-0.75) 0.86 (0.82-0.90) LMT-SPT 0.33 (0.04-0.62) 0.57 (0.33-0.77) 0.87 (0.84-0.92) LMT-SMT 0.31 (0.02-0.60) 0.57 (0.31-0.75) 0.87 (0.84-0.92) NOEMA-SPT 0.35 (0.03-0.63) 0.58 (0.32-0.77) 0.88 (0.84-0.92) PV 30 m-SPT 0.35 (0.05-0.67) 0.58 (0.34-0.77) 0.88 (0.84-0.92) PV 30 m-NOEMA 0.31 (0.02-0.60) 0.56 (0.31-0.75) 0.87 (0.84-0.92) JCMT/SMA-SPT 0.38 (0.05-0.68) 0.62 (0.36-0.81) 0.89 (0.84-0.94) SMT-SPT 0.39 (0.05-0.69) 0.65 (0.40-0.84) 0.91 (0.85-0.97) Note— Top three lines show the estimated spin values for redundant site, and bottom lines corresponds to other ones.
32th Rironkon Symposium, 12/25, 2019, NAOJ Mitaka, Tokyo, Japan
16
Rotating gas cloud around the black hole (1 period = 30 min, Broderick & Loeb (2006)
Synthetic movie using full complex visibility (EHT imaging software is SMILI)
Basic idea: Johnson et al. 2017
32th Rironkon Symposium, 12/25, 2019, NAOJ Mitaka, Tokyo, Japan
17
Moriyama et al. in press, arXiv:1910.10713
3DGRMHD simulation
(Used in EHT Collaboration et al. 2019)
32th Rironkon Symposium, 12/25, 2019, NAOJ Mitaka, Tokyo, Japan
18