Ecosystem Natural Capital Accounting (3) Presentation of the - - PowerPoint PPT Presentation

ecosystem natural capital accounting 3
SMART_READER_LITE
LIVE PREVIEW

Ecosystem Natural Capital Accounting (3) Presentation of the - - PowerPoint PPT Presentation

SUB-REGIONAL CAPACITY BUILDING WORKSHOP ON SUSTAINABLE FINANCE AND RESOURCE MOBILIZATION FOR BIODIVERSITY FOR CARICOM MEMBER STATES ST. JOHNS, ANTIGUA AND BARBUDA 18 - 21 MAY 2015 Ecosystem Natural Capital Accounting (3) Presentation of the


slide-1
SLIDE 1

Ecosystem Natural Capital Accounting (3) Presentation of the Mauritius pilot study 2013

  • n experimental ecosystem natural capital accounts

Jean-Louis Weber

Consultant to the Secretariat of the Convention on Biological Diversity Former Special Adviser on Economic-Environmental Accounting to the European Environment Agency, EEA Scientific Committee Member Honorary Professor, University of Nottingham jlweber45@gmail.com Website: ECOSYSTEM CAPABILITY http://www.ecosystemaccounting.net/

SUB-REGIONAL CAPACITY BUILDING WORKSHOP ON SUSTAINABLE FINANCE AND RESOURCE MOBILIZATION FOR BIODIVERSITY FOR CARICOM MEMBER STATES

  • ST. JOHN’S, ANTIGUA AND BARBUDA

18 - 21 MAY 2015

slide-2
SLIDE 2

The project partners

Maurice Ile Durable Mauritius Sustainable Island Commission (Prime Minister Office)

Indian Ocean Commission

Islands Project on the implementation of the 2005 Mauritius Strategy (MS) for the Sustainable Development of Small Island Developing States (SIDS). Funded by EU/ EuropAid Supervision of tests + data supply + future implementation

slide-3
SLIDE 3

The project background

  • Clear policy demand:

– International: The Programme of Action for the Sustainable Development of Small Island Developing States adopted in Mauritius, 2005 (the Mauritius SD Strategy) and its implementation by the Indian Ocean Commission – National: well identified SD issues, “green growth”, “blue growth”, “green economy”, fast change in sugar cane agriculture, tourism, urban sprawl, degradation of lagoon fisheries and coral reefs... – Natural Capital/Ecosystem Accounting: a demand by the Ministry of Finance and Economic Development and MID, the “Maurice Ile Durable” Commission, to the Indian Ocean Commission (Islands Project, EU/EuropAid funding).

  • UNFCCC/IPCC reporting (Meteo Services, with SM), National GHG inventory report of

the Republic of Mauritius 2000-2006 (2010).

  • Tradition in environmental statistics (a statistician based in the Ministry of

Environment, a statistician member of the FDES revision group...)

  • Environment-Economic Accounts, 2002 – 2009, Statistics Mauritius (SM),

covering ‘Energy Use and Atmospheric Emissions’ for the period 2002 to 2009, ‘Water Use’ for years 2002 and 2007 and ‘Economy-wide Material Flow Accounts (MFA)’ covering period 2005 to 2009 (UNDP + support). Update of SEEA-water accounts in 2013 (UNSD mission).

slide-4
SLIDE 4

The project implementation

  • First phase (2013): Inception (with MID, IOC and SM), visit to 12 organisations, collection of data

and statistics (with strong support from SM), two “training” sessions (presentation of the methodology), two stakeholders meetings (data requirements, the way forward...), creation of the database for accounting, production of preliminary accounts, production of a first detailed action plan.

  • Intermediate period: presentation of results at the UNEP VANTAGE Conference in Nairobi Dec.

2013, at UNEP Workshop on the draft guidelines for ecosystem services valuation and accounting in SIDS (New York, Feb. 2014); policy meetings in Mauritius and decision to create a special unit for environment accounting within SM.

  • Second phase (May-June 2014): Installation of the Steering Committee (Chaired by MID),

preparation of a specific action on land cover mapping (MID, Ministry of Finance, Ministry of Environment and Agence Française de Développement), data transfer and (first) technical training

  • f staff in the SM new unit, revision of the 2013 draft report in view of publication by IOC of a

report on preliminary ecosystem natural capital accounts for Mauritius; drafting of ToR for land cover mapping and accounts; and...

  • revision of the 2013 action plan for Mauritius 3rd phase: consolidation and completion of first

core accounts, development of cases studies for coastal zones/ tourism/ recreation/ fisheries; medium term capacity development, technical training of staff (ecosystem accounting, GIS, database management etc...); preparation of the extension to other IOC countries.

slide-5
SLIDE 5

Conclusions

  • Integrated ecosystem natural capital accounts are feasible in Mauritius with existing data

which are available in the country or/and from international programmes. NB Land cover change requires specific investment at early stage. Simplified accounts can be produced (rather) quickly and deliver relevant results; their accuracy can be improved in subsequent steps on the basis of the data gaps identified in the first test – and additional data collection.

  • The cost of IT investments is no more an issue; performing freeware can be used as well as

commercial software packages – and cloud computing has started to propose solutions and deliver products from the web.

  • Staffing & training (in statistics and accounting, data management, GIS applications) are

the main capacity building issues (need 2 to 3 staff in the central unit + correspondents in partner organisations). External technical support to implementing agencies is needed for the creation of the first database (typically annual accounts 2000-2012)

  • Institutional cooperation between the various agencies holding data and knowledge is
  • essential. Creation of a shared environmental information system is recommended.
  • The implementation of integrated physical accounts should facilitate further work on

assessment, modelling and valuation of ecosystem services (today, data collection alone

represents up to 80% of the cost of most environmental studies)

slide-6
SLIDE 6

Ecosystems/Natural Capital Accounts of Mauritius: Results of the Pilot Study 2013

  • Context: Mauritius Sustainable Development Strategy, “Maurice

Ile Durable”

  • Support: Indian Ocean Commission, European Union
  • An experimentation of SEEA-Experimental Ecosystem Accounting
  • Operator: Statistics Mauritius
  • Contributors: more than 10 public organisations
  • Duration: over a 7 months period, the equivalent of 5 man-

months all in all (consultant + national statistician)

  • Preliminary results…
slide-7
SLIDE 7

Ecosystem Stocks & Flows, Extent & Condition

Maintenance & remediation costs, Ecological Taxes, Mitigation banking/ Offset Certificates...

Physical ecosystems

Natural & modified inland socio- ecosystems + Sea, Atmosphere

Total Ecosystem Capability

(in physical unit-equivalent)

Degradation / Enhancement

Ecosystem services valuation (market & shadow prices), Payments for Ecosystem Services Wealth assessments

Monetary values

Bundle of intangible ecosystem infrastructure functional services (indirect measurement) Ecosystem carbon, biomass Ecosystem water Balance, Sustainable Use Index Health Index Balance, Sustainable Use Index Health Index Balance, (systems potential) Sustainable Use Index Health Index (incl. Biodiversity change)

Ecosystem capital productivity & resilience

Service h: e.g. Water regulation/ floods Service g: e.g. Water regulation/ purification Service d: e.g. Fresh water provision/ green water Service c: e.g. Fresh water provision/ blue water Service b: e.g. Timber provision Service l: e.g. Non-use values Service j: e.g. Tourism inputs Service a: e.g. Food provision Service k: e.g. Symbolic values Service f: e.g. Pollination Service e: e.g. Habitat Service i: e.g. Recreation Service g $ valuation Service a $ valuation Service c $ valuation Service b $ valuation Service e $ valuation Service d $ valuation Service f $ valuation Service h $ valuation Service i $ valuation Service j $ valuation Service k $ valuation Service l $ valuation

System and Services approaches

Integrity of ecosystem structures & functions Sustainability of ecosystem services delivery

& Ecosystem services

Provisioning, regulating & socio-cultural services

Focus on marine & inland coast (recreation, tourism, fisheries, coral reefs...)

slide-8
SLIDE 8

Main data flows to compile ecosystem natural capital accounts

Monitoring

  • data. rasters

Standard coefficients Monitoring data, samples Socio-economic statistics by regions

Disaggregate & map Aggregate & map Extrapolate Multiply

Data input Data assimilation (1 ha or 1 km2 grid) Accounts integration, analysis and reporting

slide-9
SLIDE 9

9

SEEA-ENCA Mauritius preliminary results :

Creation of Ecosystem Accounting Units

A land cover map has been produced from the start for: 1. Defining statistical units for accounting (EAU) and 2. Computing the land cover account (next slide)

Dominant land cover types (>50%) River sub-basins Socio-ecological landscape units (SELU) & Marine Coastal Units (MCU)

slide-10
SLIDE 10

10

SEEA-ENCA Mauritius preliminary results :

Land cover and change from 2000 to 2010

Land cover stock and change account/ urban sprawl 2000 2010 - km2

Rivière du Rempart Pamplemousses Flacq Moka Grand Port Plaines Wilhems Black River Savanne Port Louis

TOTAL

District AREA SQKM 14703 18019 29826 23512 26134 19839 25558 24758 3976 186325 M01 Urban land cover 2000 v0 747 705 405 282 406 2060 334 266 2667 7872 M01 Urban land cover 2000 v1, adjusted 1225 1172 667 510 549 2456 542 379 3284 10782 lf1 Urban sprawl 478 467 263 228 143 396 208 112 616 2911 M01 Urban land cover 2010 1704 1639 930 738 691 2852 749 491 3900 13693

Urban land cover 2000 & 2010

The land cover data are stored using geographical datasets which use grids (10m x 10m and 100m x 100m) at the most detailed level. These grids allow computing statistics and producing ecosystems/natural capital accounts for various statistical units such as municipal and village council areas, districts, coastal zones, river basins, socio- ecological landscape units and any relevant zoning.

Urban sprawl 2000- 2010 by Districts

Provisional

slide-11
SLIDE 11

Simplified bio-carbon accounts by districts, 2010 Tons of carbon

2010

R i v i e r e d u R e m p a r t P a m p l e m

  • u

s s e s F l a c q M

  • k

a G r a n d P

  • r

t P l a i n e s W i l h e m s B l a c k R i v e r S a v a n n e P

  • r

t L

  • u

i s Total Initial stock 2010 1457955 2101934 4135543 4165122 2855365 3327114 3173857 3196601 432317 24845808 Woody biomass 873403 1137222 2068571 1744337 1796040 1643485 2224653 2409579 265193 14162483 Topsoil organic carbon 584551 964712 2066972 2420785 1059325 1683629 949204 787022 167124 10683324 Flows/inputs 335582 417954 819601 675923 736068 454057 642970 739278 68922 4890354 Net Primary Production 335582 417954 819601 675923 736068 454057 642970 739278 68922 4890354 Flows/outputs and decrease 349143 448659 870542 708508 725853 481532 650835 744290 74976 5054339 Removals, harvests 65446 90345 108405 56498 90172 35596 87914 81900 1698 617974 Wood removals Sugarcane 63718 86585 104230 52531 87208 31984 83773 80223 912 591165 Food crops 1727 3759 4175 3656 2918 3565 4141 1633 786 26362 Other cops 311 46 46 44 447 Decrease due to land use change 4102 4761 5762 3629 3240 5216 2881 2290 1388 33269 Other decrease (fire, erosion…) 14580 21019 41355 41651 28554 33271 31739 31966 4323 248458 Soil/decomposers respiration v2 265016 332534 715020 606730 603888 407449 528301 628133 67567 4154638 Net Ecosystem Carbon Balance 1 (flows)

  • 13562
  • 30705
  • 50941
  • 32585

10215

  • 27475
  • 7865
  • 5012
  • 6054
  • 163985

Statistical adjustment 16597 28379 33235 15034

  • 29421

11163

  • 19714
  • 15632

6178 45819 Net Ecosystem Carbon Balance 2 (stocks) 3035

  • 2326
  • 17706
  • 17551
  • 19206
  • 16312
  • 27579
  • 20644

123

  • 118166

Final Stock 2010 1460990 2099608 4117837 4147571 2836159 3310802 3146278 3175957 432440 24727642 Woody biomass 876438 1134896 2050865 1726786 1776835 1627173 2197074 2388935 265316 14044318 Topsoil organic carbon 584551 964712 2066972 2420785 1059325 1683629 949204 787022 167124 10683324 Net accessible bio-carbon resource 2010 73600 83094 86875 51642 112974 30296 87089 90500 1479 617550 Change in stocks in the previous year 3035

  • 2326
  • 17706
  • 17551
  • 19206
  • 16312
  • 27579
  • 20644

123

  • 118166

Flows/inputs (+) 335582 417954 819601 675923 736068 454057 642970 739278 68922 4890354 Soil/decomposers respiration v2 (-) 265016 332534 715020 606730 603888 407449 528301 628133 67567 4154638 Index of intensity of use of bio-carbon 2010 112 92 80 91 125 85 99 111 87 100

Woody biomass/ tons of C Sugar cane harvest/ tons of C Change in NPP/ tons of C

SEEA-ENCA Mauritius preliminary results : The biomass-carbon account

Carbon Accounts show the capacity of the ecosystems to produce biomass and the way it is used by crops harvests and trees removal or sometimes sterilised by artificial developments or destroyed by soil erosion or forest fires (in line with IPCC guidelines). Accounts are compiled using various sources such as products based on earth

  • bservation by satellite (e.g. MODIS NPP), on in situ monitoring (for IPCC-

LULUCF, FAO/soil, FRA2010) and official statistics .

Provisional

slide-12
SLIDE 12

12

Simplified water accounts by Districts, 2010 Mm3

2010

Riviere du Rempart Pamplemousses Flacq Moka Grand Port Plaines Wilhems Black River Savanne Port Louis

Total

AREA_ha 14703 18019 29826 23512 26134 19839 25558 24758 3976 186325 Boreholes_nb 105 164 100 83 110 146 131 30 12 881 River runoff districts coeff 35 20 150 150 100 100 80 100 20 755 Lake 2010 ha 103 468 41 511 109 19 1251

Stocks 3345 5231 3189 2681 3510 4687 4183 961 383 28170 Aquifers 3343 5222 3184 2643 3503 4649 4171 955 382 28052 Lakes/reservoirs 7 32 3 35 7 1 86 Rivers 2 2 5 6 5 3 4 4 1 32 Soil/vegetation Net Inflows 75 176 292 342 355 293 155 353 12 2052 Rainfall 173 236 579 633 629 484 302 603 49 3688 EvapoTranspitation (actual), total 155 199 367 290 338 224 308 326 40 2247 EvapoTranspitation (actual), spontaneous 109 115 310 268 294 207 167 269 40 1779 Net transfers surface - groundwater 11 14 23 18 20 15 20 19 3 143 Transfers between basins 41

  • 41

Abstraction and Uses 63 109 80 36 63 83 152 69 23 678 Municipal Water Production 17 23 23 13 18 64 11 11 22 202

Use of water 8 12 11 7 9 32 5 6 11 101 Loss of water in distribution 8 12 11 7 9 32 5 6 11 101

Irrigation 46 85 57 22 44 17 141 57 468 Other 1 1 1 1 1 3 1 8 Waste water to rivers 6 8 8 5 6 22 4 4 8 70 Outflow to the sea 78 46 324 318 217 212 172 213 50 1632 Rivers runoff 74 42 318 318 212 212 170 212 42 1602 Waste water to the sea 4 4 6 5 2 1 8 30 Induced ETA, Evaporation 46 85 57 22 44 17 141 57 468 Net Flows

  • 103
  • 52
  • 156
  • 29

41 2

  • 304

19

  • 46
  • 626

Closing stocks 3242 5179 3034 2652 3551 4690 3879 980 337 27544 Accessible renewable water 83 124 217 200 219 187 228 213 36 1507 Water use intensity (1): Average/ha 132 114 270 561 345 224 150 310 155 Water use intensity (2): 1st decile 90 90 118 203 148 114 110 222 143

Water use intensity stress index (stress when <100)

SEEA-ENCA Mauritius preliminary results : The ecosystem water account

The ecosystem water accounts follows the SEEA Water methodology and use preliminary results of the national water accounts. They are detailed by river basins and sub-basins where the hydrological system can be described

  • consistently. Stocks of water are mainly aquifers and lakes/reservoirs, which play important role in Mauritius. Data

have provided by the meteorological and water agencies. Water use by sub-basins is estimated from population census data and irrigation map. Satellite products have been used for evapotranspiration. The outcome is the calculation of the water really accessible for use and of an index of stress from water use intensity.

Accessible water, mean amount by ha, 103 m3

Provisional

slide-13
SLIDE 13

13

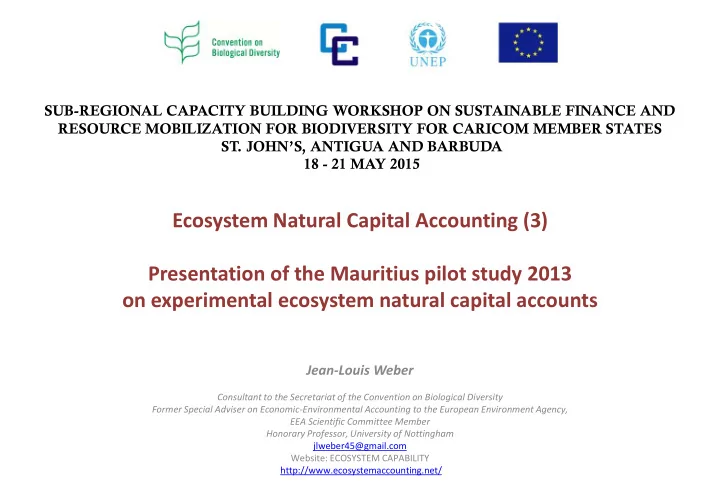
Net Landscape Ecosystem Potential (NLEP) 2010 by SELU [a], River basins [b] and Districts [c]

Green Infrastructure Accounts

R i v i e r e d u R e m p a r t P a m p l e m

  • u

s s e s F l a c q M

  • k

a G r a n d P

  • r

t P l a i n e s W i l h e m s B l a c k R i v e r S a v a n n e P

  • r

t L

  • u

i s

Total

/ Mean values AREA_ha 14703 18019 29826 23512 26134 19839 25558 24758 3976 186325

Indexes (0-100 value per ha)

GBL 2000 index 43.4 41.7 49.7 55.6 50.1 53.4 61.0 53.7 58.6 51.9 Fragmentation index 8.6 9.8 7.3 6.2 6.9 7.9 5.1 5.1 6.9 6.9 nLEP 2000 index 39.7 37.6 46.0 52.1 46.6 49.2 57.9 51.0 54.5 48.4

Green Infrastructure Account

GBL 2000 / weighted ha 638105 751152 1481482 1307506 1309039 1060139 1559660 1330151 232911 9670145 nLEP 2000 / weighted ha 583021 677761 1373059 1226033 1218167 976061 1479992 1262700 216727 9013521

Indexes (0-100 value per ha)

GBL 2010 index 42.0 40.6 49.2 55.1 49.8 52.4 60.5 53.5 50.7 51.1 Fragmentation index 8.6 9.8 7.3 6.2 6.9 7.9 5.1 5.1 6.9 6.9 nLEP 2010 index 38.4 36.7 45.6 51.6 46.4 48.2 57.4 50.8 47.2 47.7

Green Infrastructure Account

GBL 2010 / weighted ha 617999 732184 1468542 1294945 1301938 1039397 1547086 1324150 201660 9527900 nLEP 2010 / weighted ha 564651 660647 1361066 1214254 1211558 956963 1468060 1257003 187648 8881851

Change in nLEP 2000-2010

  • 18370
  • 17114
  • 11993
  • 11779
  • 6608
  • 19097
  • 11932
  • 5697
  • 29079 -131670

Change in nLEP index % 2000-2011

  • 3.2
  • 2.5
  • 0.9
  • 1.0
  • 0.5
  • 2.0
  • 0.8
  • 0.5
  • 13.4
  • 1.5

[a] [b] [c]

The biodiversity of systems and species account is made of two accounts which describe the state

  • f ecosystems green infrastructure

(landscapes, rivers and sea coastal zones) on the one hand and changes in species biodiversity on the other hand.

SEEA-ENCA Mauritius preliminary results : The functional services account (depending from integrity and biodiversity)

Provisional

The NLEP index combines the green character of ecosystems and their fragmentation by roads which may alter their good

  • functioning. Land cover is then

weighted with NLEP. Highest NLEP values can be found where forests, shrubs, grass and natural habitats are predominant, in particular in mountainous and land coastal areas. Low NLEP values correspond to urbanised areas and intermediate score reflect agriculture dominated catchments.

slide-14
SLIDE 14

14

Coral reefs vulnerability index (ESA project) Sea Coastal Units Biodiversity test account, stock 2010

SEEA-ENCA Mauritius preliminary results : the Sea Coastal Ecosystems test account

Coastal ecosystems play important role in Mauritius and a test has been done in a domain where little practical accounting experience exists. The methodology for land ecosystems has been extended to the lagoons for which ecosystem accounting units (EAU) have been defined and mapped . A test account of been produced using the inventory of “Environmentally Sensitive Areas”, using the indicator of coral reefs vulnerability, on the one hand and urban pressure on coastal ecosystems on the other hand .The conclusion is that the SEEA-ENCA methodology can be implemented in full.

Provisional

slide-15
SLIDE 15

Ecosystem capital capability and change

Ecosystem Capital Capability: ECU value by Socio-Ecological Landscape Units, 2010 Ecosystem Capital Capability (inland): Change in ECU value, % by Socio-Ecological Landscape Units, 2000-2010

Provisional

slide-16
SLIDE 16

Summary: 5 steps for implementing ecosystem natural capital accounts

slide-17
SLIDE 17

Summary: 5 steps for implementing ecosystem natural capital accounts