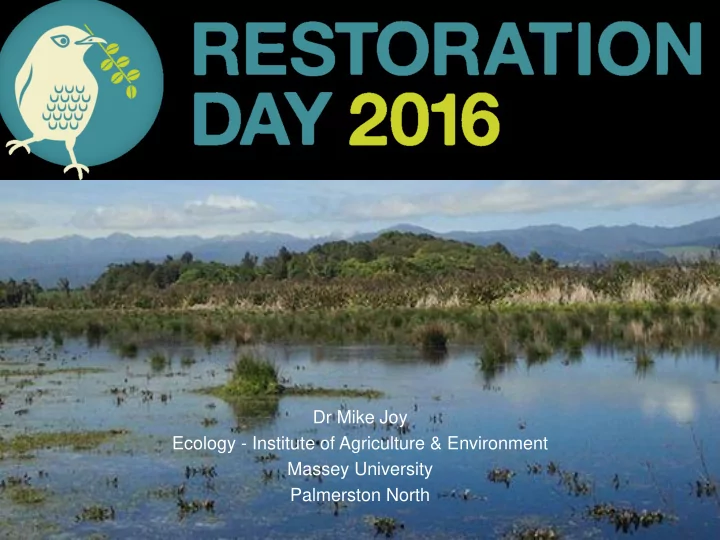
SLIDE 1
Dr Mike Joy Ecology - Institute of Agriculture & Environment Massey University Palmerston North
SLIDE 2
- 1. Some motivation - why we should care (the sad
reality - freshwater in NZ)
- 2. Why what you are doing is so important
- 3. What healthy freshwater ecosystems need
In remembrance of John Sawyer
SLIDE 3 Biodiversity
- 74% of freshwater fish threatened
- + crayfish and kakahi too
- gone by 2050
- no protection under law for
freshwater fish Highest proportion of threatened plants and animals globally including:
- 40% of native plants
- 40% of birds
- 85% of lizards
All sites
1970s 1980s 1990s 2000s IBI score
26 28 30 32 34
- No. of NZ Species Threatened and At Risk
500 1000 1500 2000 2500 3000 3500 4000 1997 2002 2005 2008/11 Year Taxa Threatened and At Risk
SLIDE 4 What a failed environment looks like:
Graphic from Susan Walker Landcare NZ
SLIDE 5
What a failed environment looks like
SLIDE 6
ANZECC trigger level Nitrate
What a failed environment looks like
SLIDE 7
ANZECC trigger level Total P
What a failed environment looks like
SLIDE 8
Healthy Doubtful Moderate pollution Severe pollution Insect community index MCI
What a failed environment looks like
SLIDE 9 Human health
NZ now has the highest frequency per-capita globally of coliform enteritis, campylobacteriosis, cryptosporidiosis and salmonellosis 18 – 34K NZers contract waterborne diseases p.a.
- benthic cyanobacteria mats (already killing dogs and horses
and one day children)
What a failed environment looks like
SLIDE 10
Ministry of health risk level Pathogens
What a failed environment looks like
SLIDE 11
“A fresh start for freshwater” NPS objectives 2014: (making the problem disappear)
A B C Before After
SLIDE 12
Primary contact (health ministry level) Secondary contact (safe in a boat?) From 260 cfu/l to 1000 cfu/l The government response to the crisis– shifting goalposts
“A fresh start for freshwater” NPS objectives 2014: (aka making the problem disappear)
After Before “I think our rivers are in pretty good shape” (Minister of Tourism John Key on Q&A a few weeks ago)
SLIDE 13 The inconvenient reality:
- The biggest impact on our freshwaters is agriculture (its
not what we are doing the way we are doing it)
- Farming within rules does NOT mean its sustainable or
NOT having impacts on waterways
- Irrigation & intensification lead to degraded waterways
and splintered communities (don’t believe me? go ask Cantabrians)
- Dams are NOT good for rivers and do not mitigate
climate change
SLIDE 14
Lonely planet guide
SLIDE 15
Clearly the government has failed so I guess its up to us now – So all power to community groups
SLIDE 16
Actually we do care!
SLIDE 17
Understanding Rivers as a living entity Rivers have evolved over thousands of years both biologically and physically Stream ecosystems driven from bottom up periphyton inverts fish Impacts: Deforestation of catchments flow alteration sedimentation Intensification = nutrient inputs excess plant growth periphyton/algal blooms + Removal of water – intensification of all impacts above and drive intensification so more nutrient and sediment
SLIDE 18 Restoration and protection of our waterways:
- 1. At the higher level the best, cheapest (e.g. 37 times
cheaper) & easiest way to protect waterways is not to pollute or damage them in the first place, so its vital to be involved in advocacy and protection (be political & vocal)
- 2. At the ‘coal face’ its riparian planting, removing
barriers, reinstating & restoring wetlands, protecting & replanting catchments, monitoring being the eyes
- f the councils …
- 3. Start at the top and work down the catchment for
water quality and for fish passage start at the bottom and work up
SLIDE 19
Example of why you have to start at the top 2006 2008 2013
SLIDE 20 Ecological Impacts of Sediment in Streams
- Sediment in waterways impacts life in two different ways
via suspended & deposited sediment
SLIDE 21 Restoration
- Make sure you define your goals
- Monitor monitor - justify investment time and money,
inspire others The value of restoration
SLIDE 22 Citizen scientists are need now more than ever before
- Monitoring protocols (SEV, SHAP, RIT)
- http://www.aucklandcouncil.govt.nz/EN/planspoliciesprojects/reports/tec
hnicalpublications/Documents/sevuserguide2011001.pdf
- http://www.envirolink.govt.nz/PageFiles/31/Stream%20Habitat%20A
ssessment%20Protocols.pdf
- http://www.niwa.co.nz/sites/niwa.co.nz/files/import/attachments/Rest
- ration-Indicators-4-WEB.pdf
The value of restoration
SLIDE 23
- Ecosystem functions of rivers, lakes & wetlands
incredibly valuable and important so what you are doing is of immense value
- Celebrate success! Give awards
- The best thing for mental health in an crisis like this is to
be doing something to stop the crisis The value of restoration