
SLIDE 1
Madr id, 16 Dezember 2002 1
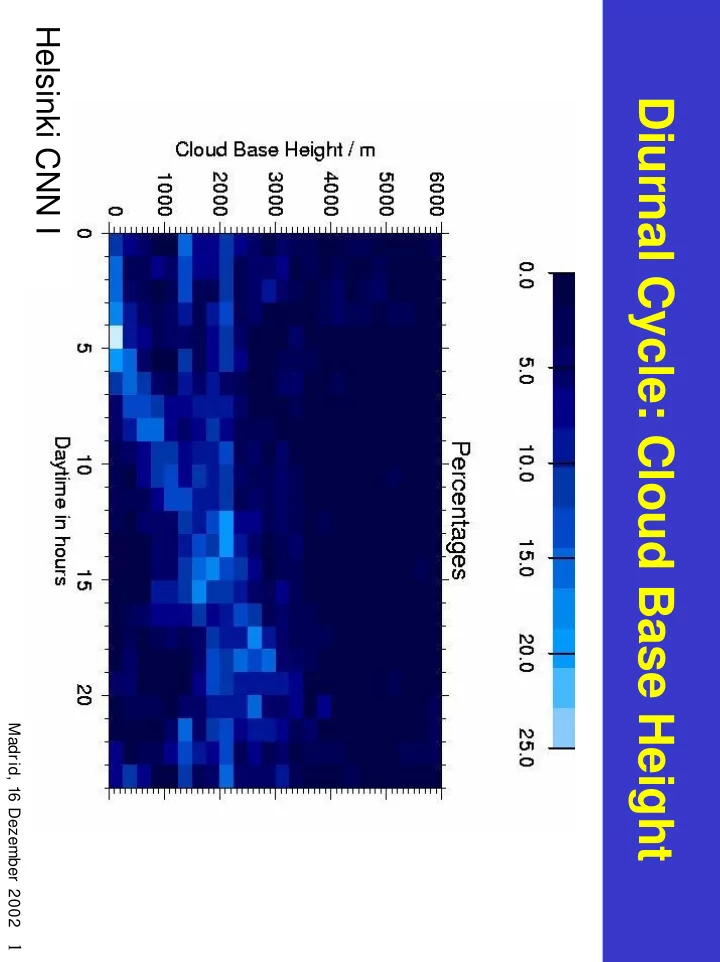
Diurnal Cycle: Cloud Base Height clear sky Madr id, 16 Dezember 2002 - - PDF document
Helsinki CNN I Diurnal Cycle: Cloud Base Height clear sky Madr id, 16 Dezember 2002 1 Cabauw Geesthacht Cabauw Geesthacht Helsinki Kiruna Helsinki Kiruna Lindenberg Onsala Lindenberg Onsala Petersburg Potsdam Petersburg Potsdam
Madr id, 16 Dezember 2002 1
Madr id, 16 Dezember 2002 2
Lindenberg Lindenberg Cabauw Cabauw Geesthacht Geesthacht Helsinki Helsinki Kiruna Kiruna Onsala Onsala Petersburg Petersburg Potsdam Potsdam
Madr id, 16 Dezember 2002 3
Madr id, 16 Dezember 2002 4
Lindenberg Lindenberg Cabauw Cabauw Chilbolton Chilbolton Helsinki Helsinki Kiruna Kiruna Onsala Onsala Petersburg Petersburg Paris
Paris Geesthacht Bern Bern
Madr id, 16 Dezember 2002 5
Geesthacht Helsinki Kiruna Lindenberg Onsala Paris Potsdam
Potsdam Onsala Paris Lindenberg Kiruna Helsinki Geesthacht
Madr id, 16 Dezember 2002 6
Cabauw Geesthacht Helsinki Chilbolton Kiruna Kiruna Lindenberg Lindenberg Onsala Onsala Paris Gotland Potsdam Potsdam
bern
Madr id, 16 Dezember 2002 7
Geesthacht Geesthacht Helsinki Helsinki Kiruna Kiruna Lindenberg Lindenberg Onsala Onsala Paris Paris Potsdam Potsdam
40 30 20 10
Madr id, 16 Dezember 2002 8
Cabauw Geesthacht Helsinki Chilbolton Kiruna Kiruna Lindenberg Lindenberg Onsala Onsala Paris Gotland Potsdam Potsdam
bern
Madr id, 16 Dezember 2002 9
Madr id, 16 Dezember 2002 10
Madr id, 16 Dezember 2002 11
Madr id, 16 Dezember 2002 12
83 (2) 21 (4) 26 (5) 12 (2) 14 (2) 56 BBC* 90 (2) 43 (6) 48 (6) 21 (3) 23 (3) 49 CNN II 83 (2) 16 (3) 20 (4) 9 (2) 10 (2) 52 CNN I f) SCL/<0 °C (%) e) SCL/base (%) d) <0 °C/base (%) c) SCL/time (%) b) <0 °C/time (%) a) Base/time (%) Period
Percentage of occurrence of: a) cloud bases detected, b) cloud bases below 0 ºC detected, c) Super-Cooled Layers (SCLs) detected, d) cloud bases below 0 ºC if a cloud base is detected, e) SCLs if a cloud base is detected and f) SCLs if a cloud base below 0 ºC is detected. Uncertainty introduced by a 1K error in temperature is given in brackets. * Measurements at 90 deg
Madr id, 16 Dezember 2002 13
Liquid Water Path distribution for the super-cooled layers detected during CNN II (N=17830) and BBC (N=10963). Time resolution is 30 s.
eff wr
LWP ρ τ 2 3 = LWP = 25 g m-2 reff=10 µm ⇒ τ= 4
Madr id, 16 Dezember 2002 14
Function of temperature. The y-axis indicates the number of measurements having the LWP value indicated on the x-axis (with a 1 g/m-2 resolution).
Madr id, 16 Dezember 2002 15
Ceilometer backscatter profile (colours) and radiosonde temperatures (white contours) for 13 April 2001 at Cabauw, The Netherlands. Wind from the North at 11 m/s.
Madr id, 16 Dezember 2002 16
a) backscatter profile for the 3 GHz radar TARA (colours) and cloud base altitude from the CT75K ceilometer. b) cloud base temperature of the super-cooled water layer (RS) c) liquid water path from the microwave radiometer MICCY. a) b) c)
Madr id, 16 Dezember 2002 17
Radio soundings on 13/04/01 from De Bilt (23 km NE from Cabauw). Shown are temperature (solid line) and dewpoint temperature (dashed line) for 6 and 12 UTC. Non continuous layers (celluar structure also on satellite images)
Madr id, 16 Dezember 2002 18
Cloud base temperature vs Liquid Water Path for 12 hours of the super-cooled layer observed on 13 April 2001. Correlation between LWP and ceilometer (0.85, 0.63, 0.82 and 0.57 ) is stronger than the one between LWP and infrared radiometer
Madr id, 16 Dezember 2002 19
Ceilometer backscatter profile (colours) and radiosonde temperatures (white contours) for 24 September 2001. The wind is easterly (110°) at about 5.5 m/s at cloud height.
Madr id, 16 Dezember 2002 20
Liquid Water Path from the radiometer MICCY for 24 September 2001. Cloud base temperature of the super-cooled water layer.
Madr id, 16 Dezember 2002 21
Madr id, 16 Dezember 2002 22