
SLIDE 1
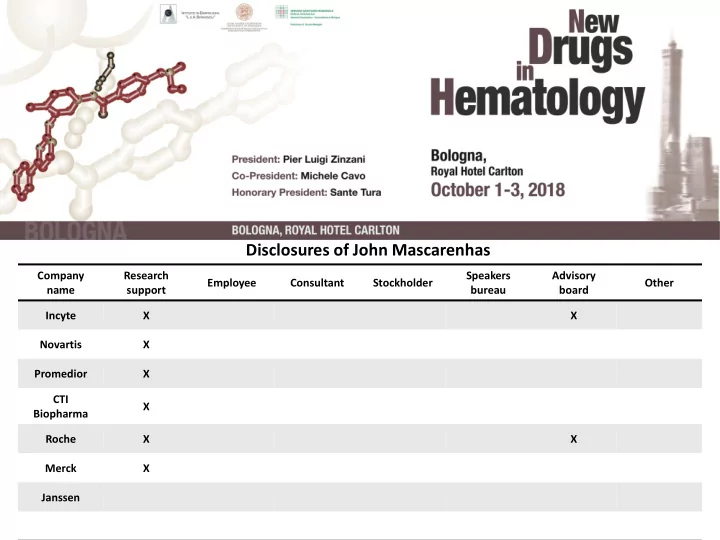
Company name Research support Employee Consultant Stockholder Speakers bureau Advisory board Other Incyte X X Novartis X Promedior X CTI Biopharma X Roche X X Merck X Janssen
Disclosures of John Mascarenhas
Disclosures of John Mascarenhas Company Research Speakers - - PowerPoint PPT Presentation
Disclosures of John Mascarenhas Company Research Speakers Advisory Employee Consultant Stockholder Other name support bureau board Incyte X X Novartis X Promedior X CTI X Biopharma Roche X X Merck X Janssen New Drugs and
Company name Research support Employee Consultant Stockholder Speakers bureau Advisory board Other Incyte X X Novartis X Promedior X CTI Biopharma X Roche X X Merck X Janssen
Disclosures of John Mascarenhas
John Mascarenhas, MD Associate Professor of Medicine Icahn School of Medicine at Mount Sinai Bologna 2018
– PI3K inhibitor – BET inhibitor
Approved Ruxolitinib Failed BMS-911543 LY2784544 Lestaurtinib AZD1280 XL019 Active late phase Pacritinib Fedratinib Inactive late phase Momelotinib Active early phase NS018 Active mid phase Itacitinib Toxicity
Active in second line Selective JAK1, combo? Failed phase 3, but is it
Toxicity derailed these, but not over! Combo trials
Bind to cIAP1, cIAP2, and XIAP Cause rapid autoubiquitinylation and proteasomal degradation of cIAPs Relieve caspase repression by XIAP
XIAP SMAC
AVPI
Courtesy: Bing Carter, PhD
Heaton et al. Leuekmia. 2018 Apr 18
Day 1 D 8 1500 mg D 15 D 22
1 cycle=28 days BM bx=baseline and at 3 months
D 29
If SD, then proceed to C2
LCL DEX
Markers of apoptosis profile
Primary Objectives:
PV MF and post-ET MF
Pemmaraju et al ASH 2017
Objective Responses
patients
CI (Symptom) 7 CI (Anemia) 5 CI (Spleen) Cytogenetic Remission (CR) 1 1
2013;122(8):1395-1398)
Grade 1/2 AEs, ≥10%, Related N (%) Non-Hematologic Grade 1/2 Fatigue 21 (55) Nausea/Vomiting 19 (50) Pain 13 (34) Dizziness/Vertigo 12 (32) Pruritis 11 (29) Diarrhea 8 (21) Fever/flu-like syndrome 8 (21) Skin eruption/rash 6 (16) All Grade 3/4 AEs, Related N (%) Non-Hematologic Grade 3/4 AE Syncope 2 (5) Nausea/Vomiting 1 (3) Hematologic Grade 3/4 AEs, Related Thrombocytopenia 3 (8) Anemia 2 (5)
LCL161 in MF: On Target Reduction of CIAP1 in Responding Patients
Pt #4 C1 D1 C3 D1
* *
pt#10 C1 D1 C2 D1 C3 D1 *
*
#8 #11 C1 D1 C2 D1 C3 D1 C1 D1 C2 D1
*
XIAP GAPDH CIAP1
Total: 10 responders (N=2 lack of adequate samples and N=4 still under the treatment)
OCI-AML3, positive control . *, molecular weight markers
OCI- #14 KG #15 LH AML3 * C1 C2 C3 * C1 C2 C3 XIAP GAPDH CIAP1 NR/SD NR/SD
Non-responders
#9 FH C1 C2 C3
* *
NR/SD
Sotatercept in MF
bone marrow stromal cells, especially GDF11
erythropoiesis
thalassemia, Diamond Blackfan anemia, and in hepcidin transgenic mice
Iancu-Rubin C et al. Exp Hematol 2013. Carrancio S et al. BJH 2014. Dussiot M et al. Nat Med 2014. Ear J et al. Blood 2015. Langdon JM et al. AJH
Sotatercept in MF
ruxolitinib
independence per IWG MRT 2013 criteria
Tefferi A et al. Blood 2013.
Sotatercept in MF
Adverse event Grade
Hypertension 3 3 2 2 Pain (joints/muscle) 3 1 2 1 1 1 Elevated UMACR 1 2 Limb edema 1 1 Headache (in the context
2 1 1 1 Nausea 1 1 Sotatercept in MF
MEAN HEMOGLOBIN OVER TIME IN RESPONDERS (N=10)
Modified Extracellular Domain
Fc Domain of human IgG1 Antibody
Sotatercept and Luspatercept: Novel Ligand Traps for TGF- Superfamily Ligands
Extracellular Domain
Fc Domain of human IgG1 Antibody
(ACE-011)
RBC Increase
+
Bone Increase
+
(ACE-536)
Therapeutic Effects
15
+
Study Design: Luspatercept Phase 2 in MPN-Associated Myelofibrosis
PARALLEL ENROLLING ICF SIGNATURE
Screening
Screening Period 4 weeks
Cohort 1 (Anemia only) 0 RBC units/84 days up to C1D1 (n = 20) Cohort 2 (RBC-tx dependent)
(n = 20) Cohort 3 (Subjects on rux. as part
Anemia only and RBC-tx dependent (n = 30) Day 169 Disease Response Assessment If clinical benefit: Continue tx for up to 1.5 additional years If no clinical benefit: Discontinue tx Posttreatment Follow-up Period
Primary Phase 168 days Posttreatment Follow-up Period 3 years post last dose END OF STUDY The Steering Committee will review all available safety and efficacy data and will serve in an advisory capacity to the Sponsor.
imetelstat binds to RNA template preventing maintenance of telomeres
phosphoramidate oligonucleotide complementary to hTR, with covalently-bound lipid tail to increase cell permeability/tissue distribution
spleen, liver (estimated human t½ = 41 hr with doses 7.5 – 11.7 mg/kg);
telomerase: IC50 = 0.5-10 nM (cell- free)
proliferation
(hTR)
(hTERT)
lipid tail
Imetelstat: First in Class Telomerase Inhibitor
Primary Endpoint: Overall Response by IWG-MRT
N = 33 (%) Overall Response (CR+PR+CI) 12 (36.4%) Complete Remission (CR) 4 (12.1%) Partial Remission (PR) 3 (9.1%) Clinical Improvement (CI) by Anemia 1 (3.0%) Clinical Improvement (CI) by Spleen 4 (12.1%) Stable Disease (SD) 21 (63.6%) Spleen Response (by palpation lasting ≥ 12 weeks ) 8/23 (34.8%) Transfusion dependent becoming transfusion independent 4/13 (30.8%)
CR/PR: 21.2% CR/PR/CI: 36.4%
18
Tefferi et al. N Engl J Med. 2015 Sep 3;373(10):908-19.
Co - Primary Endpoints
24 – The percentage of participants who achieve ≥ 35% reduction in spleen volume from baseline as measured by MRI
Week 24
≥50% reduction in total symptom score as measured by modified MFSAF v2.0.
Key Eligibility Criteria*
after JAK inhibitor
count of <10%
A Randomized, Single-Blind, Multicenter Phase 2 Study to Evaluate the Activity of 2 Dose Levels of Imetelstat in Subjects With Intermediate-2 or High-Risk Myelofibrosis (MF) Relapsed/Refractory to Janus Kinase (JAK) Inhibitor Imetelstat 9.4 mg/kg IV every 3 weeks Imetelstat 4.7 mg/kg IV every 3 weeks
Randomization
N=200
Until disease progression, unacceptable toxicity, or study end.
1:1
*Not a complete list of inclusion and exclusion criteria
IMbarkTM (NCT02426086)
Pro-inflammatory macrophages Pro-fibrotic macrophages Pro-resolutive macrophages Hypothesis: Reduction of bone marrow fibrosis will restore hematopoiesis and improve cytopenias
in pre-clinical models
– Also low in patients with renal, pulmonary and liver fibrosis
Weekly PRM-151 10 mg/kg IV Monthly PRM-151 10 mg/kg IV Weekly PRM-151 10 mg/kg IV + ruxolitinib Monthly PRM-151 10 mg/kg IV + ruxolitinib
27 Patients Enrolled
– Patients with clinical benefit may continue beyond 24 weeks
7 8 6 6
20 Patients completed 24 weeks 13 patients completed 72 weeks
5 9 5 6 4 4
1 PD 2 deaths 1 PD 1 lack of benefit 1 death 1 splenectomy
2 stopped < 72 weeks 5 switched to monthly 1 stopped rux 3 stopped < 72 weeks 2 stopped < 72 weeks 5 switched to monthly
All Possibly Related Adverse Events Through 72 Weeks (n=13)
Adverse Event Grade 1 Grade 2 Grade 3 Total ANKLE SWELLING 1 1 DIARRHEA 1 1 ANEMIA 1 1 COUGH NONPRODUCTIVE 1 1 HYPERURICEMIA 1 1 BLURRED VISION 1 1 FATIGUE 2 2 TOOTH INFECTION 1 1 SKIN INFECTION 1 1 HSV INFECTION 1 1 HOT FLASHES 1 1 SWEATING 1 1
6 SAEs in 4 patients - none related: wound infection, multiple fractures, bladder rupture, bowel obstruction, focal pneumonia, and unspecified infection
Response = % of patients with ≥1 grade reduction in MF score at any time point
clustering, Normal or decreased myeloid:erythroid ratio, Fewer paratrabecular megakaryocytes
% Patients with Bone Marrow Improvement Patient n 13 10 6 6 6 5
10 20 30 40 50 60 70 80
Wk 12 Wk 24 Wk 36 Wk 48 Wk 60 Wk 72
WHO MF Response
Hemoglobin (g/L) and % of patients with transfusions Patients with baseline Hgb < 100 g/L who completed ≥ 72 weeks (n=5)
20 40 60 80 100 120
Baseline Week 12 Week 24 Week 36 Week 48 Week 60 Week 72
Median Hgb (g/L) % receiving RBC transfusions
10.7g/dL 8.6g/dL
Platelets x 109/L and % of patients with PLT transfusions Patients with Baseline Platelets < 100 x 109/L who completed ≥ 72 weeks (n=9)
10 20 30 40 50 60
Baseline Week 12 Week 24 Week 36 Week 48 Week 60 Week 72 Median PLT (x 109/L) % pts receiving plt transfusions
52K 37K
TSS % Change from Baseline
MPN-SAF TSS Best % Change from Baseline (n=13)
20 40 60 80 100
PRM-151 alone PRM-151 + RUX
2
23 29 35 4 19 47 7 12 33 21 11 23
Baseline TSS
70%
Best spleen % Change From Baseline Spleen % Change from Baseline
PRM-151 alone PRM-151 + RUX Patients with palpable spleen at baseline (n = 10) * *1 patient had no improvement
Baseline Spleen
20 11 21 22 15 26 13 23 13 7
JAK inhibitor Combination partner/setting MPN Phase Clinicaltrials.gov identifier Ruxolitinib TGR-1202 PV, MF, MDS/MPN 1 NCT02493530 Ruxoilitinib Idelalisib MF 1 NCT02436135 Ruxolitinib INCB050465 MF 2 NCT02718300 Ruxolitinib Danazol MF 2 NCT01732445 Ruxolitinib Thalidomide MF 2 NCT03069326 Ruxolitinib Lenalidomide MF 2 NCT01375140 Ruxolitinib Azacytidine MF, MDS/MPN 2 NCT01787487 Ruxolitinib Panobinostat MF 1b 1/2 NCT01433445 NCT01693601 Ruxolitinib Pracinostat MF 2 NCT02267278 Ruxolitinib Decitabine MPN-AML 1/2 1/2 NCT02257138 NCT02076191 Ruxolitinib PIM447 + LEE011 MF 1 NCT02370706 Ruxolitinib Vismodegib MF 1/2 NCT02593760 Ruxolitinib Navitoclax MF 2 NCT03222609 Ruxolitinib Pegasys MF 1/2 NCT02742324 Ruxolitinib HSCT MF 2 NCT01790295 Ruxolitinib HSCT MF Pilot NCT02917096 Ruxolitinib AutoSCT MF Pilot NCT02469974
Modified from Mascarenhas et al. Hematology Am Soc Hematol Educ Program. 2015;2015:329-39
Combination of BET and JAK Inhibitors is Efficacious in MF model
Combination significantly improves spleen weight, fibrosis and tumor burden
levels of MDM2 compared to normal CD34+ cells
IFNα 2a increase p21 and PUMA protein levels in PV CD34+ cells and promote apoptosis
Nutlin and Peg-IFNα 2a reduce the numbers of JAK2V617F- positive cells transplanted in NOD/SCID mice
Lu M et al. Blood. 2012 Oct 11;120(15):3098-105;Lu et al. Blood. 2014 Jul 31;124(5):771-9
MDM2 positive cells (% of total MNC)
N
m a l P V 20 40 60 80
P=0.01
1 2 3 4 5 6 7 8 C1D1 C1D5 Plasma MIC-1 levels (pg/ml)
P=0.004
N=6
Not evaluable (NE) No response (NR) Partial Response (PR) Complete Response (CR) Overall Response (PR+CR) PART A (n=12) 1# 4 3* 4 7 (58%) PART B (n=4)^ 1+ 1 1 1 2 (50%) PART A + PART B ORR 9 (75%)
1Barosi et al Blood 2013
By 6 cycles of therapy with idasanutlin monotherapy in PART A and combination pegylated interferon-α in PART B
4 7 8 4 12 3 9 8 10 6 8
Driver mutation responses with idasanutlin therapy
12 3 9 8 10 6 8 4 7 8 4 Median % reduction - 43% (range -91.9% to +60.3%) 52% 69% 89% 82% 87% 2% 24% 23% 45% 36% 6%
Baseline VAF
Mount Sinai Ronald Hoffman Xiaoli Wang Vesna Najfeld Joseph Tripodi Anna Rita Migliaccio Marina Kremyanskaya John Roboz Min Lu Luena Papa Daniel Hathaway Camelia Iancu-Rubin John Mascarenhas Jiajing Qiu Goar Mosoyan Eran Zimran Bruce Petersen Myron Schwartz Lina Jung Alicia Orellana MSKCC Ross Levine Raajit Rampal Franck Rapaport University of Utah Mohammed Salama New York Blood Center Rona Weinberg Xu Wu Mayo Clinic Scottsdale Ruben Mesa Amylou Dueck Heidi Kosiorek MPD-RC Mary Frances McMullin Jean-Jacques Kiladjian Joanne Ewing Murat Arcasoy Elliot Winton Claire Harrison Rose Catchatorian Andrea Bacigalupo Richard F. Schlenk Arnon Nagler Craig Kessler Alessandro Rambaldi David Liebowitz Adam Mead Valerio De Stefanno Alessandro Vannucchi Damiano Rondelli Abdulraheem Yacoub Josef Prchal Casey O’Connell Dmitry Berenzon, Richard Silver Ellen Ritchie Gabriela Hobbs
Therapeutic Hypothesis Treatment with a TGF-β inhibitor may treat PMF by providing proliferative advantage to healthy HSC in the marrow and preventing formation of myelofibrosis-HSC supporting niches in the spleen
Hematopoietic failure MF Hematopoiesis
Marrow Spleen
MF-HSC HSC MF-MK MF-HSC TGF-β MF- activated fibrocytes “Normal niche”
Courtesy of Annarita Migliaccio
Osteogenesis Marrow fibrosis Neovascularization Hematopoiesis In liver PE
FITC-Sca1 Stem / progenitor cell trafficking Natural Death Age (Months) Birth 1 8 12 24 Pre -M Early -M M Thrombocytopenia Anemia Young Old 3.5% 1.9% 24.4% 70.2% Thrombosis Osteogenesis Neovascularization PE
FITC-Sca1 Birth 1 8 12 24 Pre -M Early -M M Thrombocytopenia Anemia Young Old 3.5% 1.9% 24.4% 70.2% Thrombosis
Natural history of myelofibrosis in Gata1low mice
Varricchio et al Expert Rev Hematol 2009;2:315