
SLIDE 1
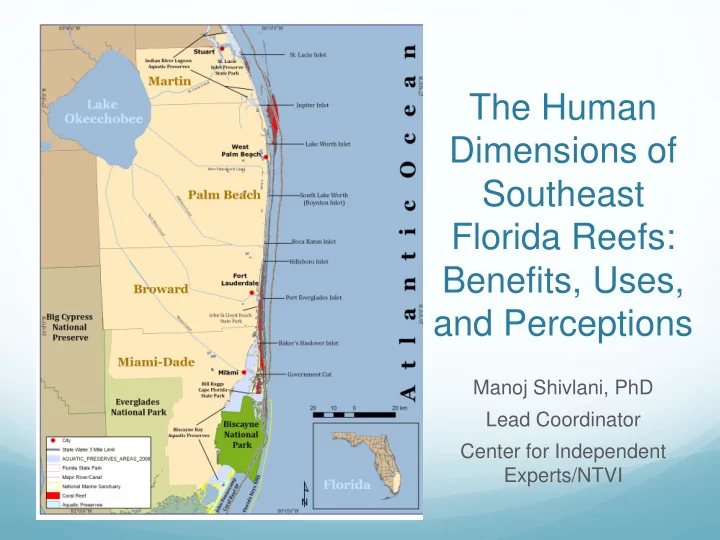
The Human Dimensions of Southeast Florida Reefs: Benefits, Uses, and Perceptions
Manoj Shivlani, PhD Lead Coordinator Center for Independent Experts/NTVI
Dimensions of Southeast Florida Reefs: Benefits, Uses, and - - PowerPoint PPT Presentation
The Human Dimensions of Southeast Florida Reefs: Benefits, Uses, and Perceptions Manoj Shivlani, PhD Lead Coordinator Center for Independent Experts/NTVI Outline I will focus on the human dimensions of coral reefs in southeast
Manoj Shivlani, PhD Lead Coordinator Center for Independent Experts/NTVI
southeast Florida, presenting information and analysis on:
reefs
management preferences
10 20 30 40 50 60 70 80 90 100 Population % of FL population Millions/percengate Florida Southeast Florida
growing by 714% over the past 60 years 700,000 residents in 1950 5.7 million residents in 2010
1000000 2000000 3000000 4000000 5000000 6000000 1950 1960 1970 1980 1990 2000 2010 Populaton Year Miami-Dade Broward Palm Beach Martin
Population densities increased considerably in the post war years,
as well, going from an average of 101.8 persons/mile2 in 1950 to an average of 828.9 persons/mile2 in 2010
These figures do not account for areas protected from building,
and effective population densities are much higher
Broward County is the 2nd most populous county in FL
200 400 600 800 1000 1200 1400 1600 1800 1950 1960 1970 1980 1990 2000 2010 Population density Year Miami-Dade Broward Palm Beach Martin Southeast Florida
always centered near the coast in southeast Florida The first areas to be
developed in the region were invariably the waterfront and coastal areas, to the detriment of coastal and nearshore habitats
With a few exceptions,
growth swung to inland areas only from the 1970s onwards, after the much of the coastal belt had been built out
Direct benefits are those
related to the values derived clearly from coral reefs
These are the benefits
that most people can “see” and appreciate
income and enjoyment derived from: Fishing Diving and snorkeling Other recreation and uses
The last major, reef use study on the value of natural and
artificial reefs was completed almost 15 years ago
In short, we don’t know how much MORE coral reefs are
worth today
Johns et al., 2004 and Johns et al., 2001reported that reefs in
the early 2000s contributed over $3.5 billion and almost 36,000 jobs to the regional economy
Total landings do not represent value from coral reefs, but many
species landed do spend some time on reefs and reef associated ecosystems
Spiny lobster, reef finfish, coastal migratory finfish
Landings averaged 7 million pounds from 1994-2010 Most important species included king and Spanish mackerel, bait shrimp, reef finfish, and
finfish
While this figure does not show the direct benefits accrued from fishing trips and is not specific to the southeast Florida region, it is clear that from the totals that recreational fishing is a major industry in the region
Recreational fisheries account for a majority of all fin fish landings in southeast Florida
Almost 6 million anglers took 25 million fishing trips in 2012 in the State of Florida Benefits from local and out of state anglers include contributions to bait shops, fishing licenses, charter vessels, headboats, boating establishments, and even the lodging and hospitality industry
Indirect benefits
Indirect benefits are
those benefits that coral reefs provide but which are not easily or clearly
discerned
Indirect benefits
include ecosystem services, storm protection, biodiversity generation, and biomedical potential
hurricane alley and are presently at the start of another hurricane season
absorb storm energy and slow down wave actions during storms
Our reefs, like those
across the tropical
amounts of biodiversity
An estimated 25% of
fish species are found
These reefs and
environs can serve as source sites for seeding other locations
Connecting
metapopulations
Kough et al. (2013) shows source-sink dynamics and connectivity for spiny lobster in the Caribbean and NW Atlantic
Biomedical potential and
realities
Coral skeletons
themselves are used as bone grafts
Antivirals such as AZT
and anti-cancer drugs have been isolated from sponges on Caribbean coral reefs
Prospects of finding
new drugs in the ocean are much higher than on terrestrial ecosystems, due in part to phylogenetic diversity
Caribbean sea whip, Pseudopterogorgia elisabethae
Because of the proximity of the
reef tract and multiple benefits, the upper Florida reef tract is heavily used
Parts of the reef are located
as close as one mile from the shoreline
Uses of the coral reef and
associated habitats include:
Fishing Diving and snorkeling Boating Surfing, kiteboarding, paddle
boarding, kayaking, and
Many of the 30 million
visitors and 6 million residents use southeast Florida’s coral reefs and associated coastal and marine resources
Activities undertaken on or
adjacent to the reefs start with beach visitation, which is among the most popular tourism attractions for visitors and residents alike
In a 2005 AA 2 project, we
found that many beach visitors in four SE FL beaches undertook water- based activities
10 20 30 40 50 60 70 80 90 100
Swim Snorkel/dive Fish Boat Sail Surf Kayak Glassbottom
Activity Percentage
SB FLB SI JB Total
Commercial and for-hire fishing
The following maps from project FDOU 10 show areas of use
among charter and commercial fishers
The areas fished for the most part cover the reef tract, showing the
dependence of the fisheries on the coral reef habitat
target species While offshore species were the most important species and
most often targeted, 30% targeted reef fish on their fishing trips and almost a third considered reef fish their most important species
5 10 15 20 25 30 35 40 45 Nearshore Reef Offshore Highly migratory Other Species group Percentage Targeted Most important
Use, as can be expected,
was limited to shallow water for a majority of dive and snorkel trips
Use patterns data showed
that trips were taken to nearby locations unless for specialized trips
An average of 263 trips
taken per year by
taken to natural than artificial reefs
Boating Trends in total registered vessels in southeast Florida, 1964-2001. (a.) Total number of registered recreational and commercial vessels. (b.) Number of registered commercial vessels by county. (c.) Number of registered recreational vessels by county
A 2008-09 study conducted
by Behringer et al. evaluated vessel use via the identification of vessel use patterns in the region
The study used aerial
surveys to ascertain vessel locations and attributes, analyze use data for patterns, and to develop a GIS framework to facilitate visualization and analysis of use patterns relative to natural reefs
Vessel Class
R e c r e a t i
a l C
m e r c i a l C
m e r c i a l ( H e a d b
t ) R e s e a r c h O t h e r U n k n
n
Percentage of all vessels 20 40 60 80 100
Vessel size
< 10 m 10 - 20 m > 20 m
Percentage of all vessels 20 40 60 80 100 Vessel status
A d r i f t A n c h
e d M
e d T r
l i n g O t h e r
Percentage of all vessels 10 20 30 40 50 60
Vessel activity
D i v i n g a n d F i s h i n g D i v i n g / s n
k e l i n g F i s h i n g F i s h i n g ( T r
l i n g ) O t h e r U n k n
n
Percentage of all vessels 10 20 30 40 50
Vessel status
Adrift Anchored Moored Trolling Other
Percentage of vessels in each use level 10 20 30 40 50 60
Weekday Weekend Holiday
Vessel activity
Diving and Fishing Diving/ snorkeling Fishing Fishing (Trolling) Other Unknown
Percentage of vessels in each use level 10 20 30 40 50 60 70
Weekday Weekend Holiday
Location Quotient: ratio of proportions used to measure the concentration of a given group or activity in a specific geographic area relative to the concentration of the same group or activity within the larger study region. % of vessels over a habitat type % of total area that habitat represents Ratio > 1.0: more vessels were observed over the habitat type than would be expected given the relative areal extent of the habitat. Ratio = 1.0: the number of vessels observed was as would be expected given the relative areal extent of the habitat. Ratio < 1.0: the number of vessels observed was less than would be expected given the relative areal extent of the habitat.
Habitat Type Area Anchored Vessels All Vessels % Count % Ratio Count % Ratio Artificial 2.85 50 6.32 2.22 89 3.88 1.36 Hard-bottom 29.39 202 25.54 0.87 623 27.13 0.92 Reef 10.48 208 26.30 2.51 514 22.39 2.14 Sand 53.10 325 41.09 0.77 1,061 46.21 0.87 Seagrass 3.77 6 0.76 0.20 8 0.35 0.09 Unknown 0.42 0.00 N/A 1 0.04 0.10 Totals 100.0 791 100.0 1.00 2,296 100.0 100.0
recreational.
more recreational vessels were anchored compared to commercial.
Palm Beach County.
expected based on its areal extent
Florida reefs inform decision makers on what these groups know concerning the status and trends of the reefs
measure future changes in knowledge and attitudes
preferences can provide guidance for management measures that will be viewed as legitimate and therefore increase compliance
Three main studies on public and stakeholder perceptions
conducted in the region over the past decade
1. Awareness and Appreciation (AA) project 2
Gauged resident, visitor, and stakeholder knowledge of the region’s
coral reefs and associated resources
2. Fishing, Diving, and Other Uses (FDOU) project 10
Evaluated stakeholder views on the region’ coral reefs and associated
resources, including conditions, trends, and stressors
3. FDOU project 18-20B
Worked with key informants in the larger stakeholder community to
region’s coral reefs more effectively
sub-projects: 1. Visitor beach survey project
Intercept surveys, with 1,773 completed surveys
2. Resident mail back survey project
Mail-back surveys, with 619 returns from 12,000 mailers
3. Stakeholder interview project
60 in-person interviews with members of different user groups
4. Marine industry electronic mail and telephone survey project
70 email and phone completed interviews
5. Registered boater field intercept survey project
Intercept surveys, with 356 registered boaters in the region
understanding among residents and visitors alike on coral reefs, that reef exist in the region, that the reefs serve multiple purposes, and provide benefits, and that the reefs deserve protection BUT, many visitors and
residents identified the Florida Keys as the primary location
not southeast Florida
VII II I VI III IV V
14 14 95 14 17 15 19 Visitor Survey Where coral reefs are found
¯
25 50 12.5 Miles
by the prevailing view that respondents did not consider fisheries as a major threat to coral reefs
pointed to runoff from agriculture and development
pointed to overuse
FDOU project 10, conducted from 2007-08, consisted of surveys
with the various stakeholder groups to characterize their uses and to identify their concerns on coral reefs
Six stakeholder groups surveyed, for a total of 1,962 surveys
Group Population (N) Sample (n) Methodology
1,247 193 Field-based interviews
377 59 Field-based interviews
– anglers 10,000* 1,058 Mail-back surveys
– lobster divers 400 Field intercept surveys
166 46 Field-based interviews
55 Field-based interviews
900 151 Internet-based surveys
FDOU Project 10 main findings
All stakeholder groups were able to provide spatial use areas and use patterns, from when they first started to the present
Use maps showed a high diversity in use based on stakeholder group and the type of use (ex., gear, species)
Most stakeholders stated that they had moved their areas of use, as resources including reefs had degraded over time
they first started
–
As well as fisheries and use conflicts
consumptive groups
Stakeholder group Fisheries Coral reefs Artificial reefs Water quality Use conflicts Charter fishing
3.12 3.67 2.43 3.78 3.73 Commercial fishers 3.28 3.49 2.51 3.73 3.70 Dive operations 3.68 3.70 2.57 3.78 3.60 Recreational anglers 3.47 3.74 2.68 3.78 3.54 Researchers and managers 3.79 3.98 2.90 3.65 3.31 Surfers 3.53 4.06 3.33 3.42 3.40
Views on resource and issue trends (where the mean score is based on a scale from 1-5, where 1 = better conditions and 5 = worse conditions)
significant indirect threat to coral reefs in the region
warming.
Stakeholder group LBS Coastal development Dredging and filling activities Global warming Charter fishing operations 4.61 4.44 4.41 3.13 Commercial fishers 4.60 4.14 4.29 3.45 Dive operations 4.71 4.47 4.64 3.64 Researchers and managers 4.21 4.37 3.96 3.86 Surfers (in percentages) 36 33 19 2
Views on indirect impacts (where the mean score is based on a scale from 1-5, where 1 = least indirect impact and 5 = most indirect impact)
Stakeholder group Enforcement Zoning Education Limited entry Current Less Charter fishing
2.14 3.81 2.80 3.56 3.97 5.31 Commercial fishers 3.08 4.19 2.56 3.74 3.52 4.99 Dive operations 2.20 2.11 1.72 4.28 3.72 5.37 Recreational Anglers* 26.7 17.2 35.4 6.7 11.5 2.4 Researchers and managers 3.26 1.91 2.72 4.63 5.70 5.98 Surfers* 22 29 30 2 2
Preferred forms of management (where the mean score is based on a ranking scale from 1-6, where 1 = most preferred form of management and 6 = least preferred form
agreement that coral reef conditions have deteriorated in southeast Florida
10 20 30 40 50 60 70 Better Same Worse Condition Percentage
Coral reefs Water quality 10 20 30 40 50 60 Better Same Worse Condition Percentage Coral reefs Water quality 10 20 30 40 50 60 70 Better Same Worse Don't know Resource condition Percentage Coral reefs Water quality
5 10 15 20 25 30 35 40 45 50 Significantly better Somewhat better Same Somewhat worse Significantly worse I don't know Condition Percentage Coral reefs Water quality
Charter fisher views on coral reefs and water quality Commercial fisher views on coral reefs and water quality Recreational fisher views on coral reefs and water quality Surfer views on coral reefs and water quality
Study conducted from 2009
to 2011
Study involved the
establishment of key informant panels to conduct interviews
Study selected participants
based on tenure and participation in previous SEFCRI studies
The video was made
available to participants via DVD or on a website created for the project
The video ensured that all
participants had the same level of knowledge before conducting the interview
Commercial operators use profiles showed that commercial and charter fishers used most of the region
Dive operators relied on discrete areas closer to shore
All groups interviewed reported moderate to high levels of conflict
Limited space and competing uses in the highly congested nearshore areas likely contributed to conflicts
RESOURCE CONDITIONS (1 = excellent; 5 = very poor) All counties Miami- Dade County Broward County Palm Beach County Martin County
3.38 (0.83) n = 239 3.33 (0.82) n = 81 3.52 (0.83) n = 64 3.31 (0.83) n = 52 3.37 (0.88) n = 42
3.66 (0.79) n = 182 3.67 (0.72) n = 53 3.91 (0.77) n = 55 3.39 (0.80) n = 42 3.59 (0.80) n = 34
3.26 (0.90) n = 102 3.41 (0.90) n = 34 3.24 (1.01) n = 19 3.09 (0.91) n = 29 3.28 (0.82) n = 20
3.77 (0.92) n = 74 3.45 (0.91) n = 22 3.95 (1.00) n = 22 3.88 (0.93) n = 17 3.85 (0.69) n = 13
3.58 (0.97) n = 133 3.60 (0.92) n = 36 3.92 (1.10) n = 22 3.25 (1.03) n = 42 3.76 (0.72) n = 31
3.59 (0.96) n = 164 3.50 (0.94) n = 49 3.96 (0.94) n = 65 3.29 (0.96) n = 42 3.66 (0.88) n = 32
3.44 (1.13) n = 156 3.58 (1.11) n = 42 3.66 (1.17) n = 34 3.27 (1.12) n = 44 3.25 (1.09) n = 36
!
Pollution was identified as the main threat to Southeast Florida corals
Other threats identified included:
Overuse
Overfishing
Physical impacts
Freshwater discharges
Nourishment
Coastal Development
Climate Change
Death by 1,000 cuts
Inadequate enforcement = low support for management alternatives
Present management Effective enforcement Support for management alternatives
interviewed favored some type of marine managed area management
marine managed areas were more likely to support restricted zones
As shown above for Broward County, stakeholders selected very specific areas for protection, based on local knowledge, preferences, and expected benefits
Fishing then and now
studies conducted over the past decade
some of which are local, others that are regional, and other which are global Population, uses, and stressors
coral reefs, a resource that all stakeholders value and would like to see protected
stakeholder groups agree that current management is not working