SLIDE 1
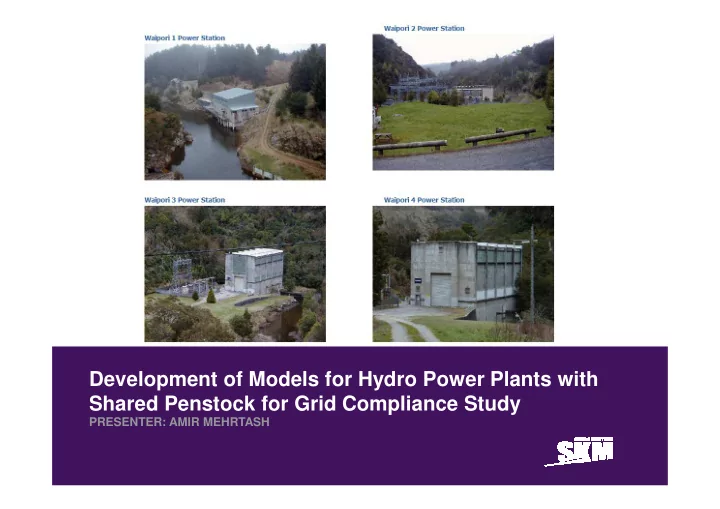
Development of Models for Hydro Power Plants with Shared Penstock for Grid Compliance Study
PRESENTER: AMIR MEHRTASH
SLIDE 2 Contents
- 1. Introduction
- 2. Network Model
- 3. Plant/Frame Model
- 4. Excitation System Model
- 5. Prime-Mover/Turbine Model
- 6. Governor Model
- 7. Governor/Turbine Tests
- 8. Conclusion
SLIDE 3 Introduction
- The Waipori River is located about 64 km to the west of Dunedin, rising
in the Lammerlaw Mountains. After winding through a course of about 24 km the River emerges into a valley 1.5 km wide and 27 km long, with a drop of only 30-metres. Following the first steps towards generating electricity from the Waipori River in May 1900, on 27th April 1907 the Waipori Hydro-Electric Power Station was commissioned. This hydro scheme consists of four generation stations as follows:
- Station 1A (separate penstock): Unit G1A: 12.88 MVA, 0.75pf.
- Station 2A (shared penstock):
– Unit G2A-1: 23.00MVA, 0.91 – Unit G2A-2: 26.15MVA, 0.90pf – Unit G2A-3: 26.15MVA, 0.69pf
- Station 3 (separate penstock): Unit G3: 8.0MVA, 0.80pf.
- Station 4 (separate penstock): Unit G4: 9.0MVA, 0.80pf.
SLIDE 4
Network Model (DIgSILENT)
SLIDE 5 Plant/Frame Model: Separate Penstock
sym Slot ElmSym*
xmdm a b c d e f g h u1r:bus1 u1i:bus1 cur1r cur1i psie b c d e g h 1 2 3 4 5 6 7 8 9 10 1 2 3 4 5 6 7 8 9 10 11 12 13 14 15 16 17 18 19 20 20 22 23
vco slot ElmVco*
a 1 2 3 4 5 6 7 8
Input file ElmFile*
y1 y3 y4 y5 1 2 3 4
pcu Slot ElmPcu*
fe psco pturb c d e f g h c d e f g h 1 2 3 4 5 6 7 8 9 10 11 12 1 2 3 4 5 6 7 8 9 13
pmu Slot ElmPmu*
1 2 3
pss slot ElmPss*
Pg b c a b c 1 2 3 4 5 6 7 8 1 2 3
w(1) pg qg dw cosn sgnn w pgt fe_inj ve rvp s gn n (.. gatepos bladepos w(2) upss pt curgn curex xmt xme fe pgt(1.. u
SLIDE 6
Plant/Frame Model: Common Penstock
SLIDE 7
Excitation System Model(Standard SEXS Model)
SLIDE 8
Turbine and Penstock Model – Single Penstock
SLIDE 9
Nonlinear Model of Multiple Penstocks and Turbines Supplied from Common Tunnel [Ref1]
SLIDE 10
Turbine Model – Common Penstock
SLIDE 11
Penstock Model – Common Penstock
SLIDE 12 Penstock Time Constant (Water Starting Time Constant)
- Constant diameter penstocks:
where Q is the maximum flow rate (m3/s), H is the head (m), L is length of penstock (m), A is penstock area (m2), and g=9.8m/s2 is the gravity constant.
- Varying diameter penstocks:
A H g L Q Tw × × × =
∑
=
× =
n i i i w
A L H g Q T
1 Station Q (m3/s) H (m) L (m) A (m2) Tw (s) 1A 42 27 173.7 10.18 2.71 2A (Common Section) 37 223.5 650 3.1 3.57 2A-1/2A-2 (Individual Section) 37 223.5 50 3.1 0.27 2A-3 (Individual Section) 37 223.5 125 1.86 1.13 3 19 50.57 88.5 4.1 0.83 4 19 57.3 108 4.1 0.9
SLIDE 13
Governor Model
SLIDE 14 Governor/Turbine Tests
- 1.1. On-line Frequency Step Test (Unit G2A-1)
SLIDE 15 Governor/Turbine Tests
- 1.2. On-line Frequency Step Test (Unit G3)
SLIDE 16 Governor/Turbine Tests
- 1.3. On-line Frequency Step Test (Unit G4)
SLIDE 17 Governor/Turbine Tests
- 2.1. Governor Stability (Station 2A): As-left PID Parameters
as-left PID parameters: Kp=2 and Ki=0.14
SLIDE 18 Governor/Turbine Tests
- 2.1. Governor Stability (Station 2A): Modified PID Parameters
modified PID parameters: Kp=0.5 and Ki=0.01
SLIDE 19 Governor/Turbine Tests
- 2.2. Governor Stability (Station 3): As-left PID Parameters
SLIDE 20 Governor/Turbine Tests
- 2.3. Governor Stability (Station 4): As-left PID Parameters
SLIDE 21 Conclusion
- The Governor/Turbine model is capable of predicting the plants’
behaviour during frequency excursions (for the stations 2A, 3 and 4).
DIgSILENT model implemented (using the as-left parameters) for station 2A predicts sustained
behavior (not unstable) after a small step change in resistive load (all units operating at 80% load whilst isolated from the grid). It can be rectified by adjusting the PID parameters.
- The plant model implemented (using the as-left PID parameters)
for stations 3 and 4 predicts stable and damped behaviour at entire range of active output power (whilst isolated from the grid)
SLIDE 22
References
1) “Hydraulic Turbine and Turbine Control Models for System Dynamic Studies”,
IEEE Working Group on Prime Mover and Energy Supply Models for System Dynamic Performance Studies, IEEE Transactions on Power Systems, vol. 7, No.1, Feb 1992.
2) “Electricity Industry Participation Code”, Electricity Authority, New Zealand:
http://www.ea.govt.nz/act-code-regs/code-regs/the-code/
3) “Waipori 3 Power Station, Unit No. 1 - Governor Replacement Commissioning “,
Contech Services Ltd report dated November 2008.
4) “Waipori 4 Power Station, Unit No. 1 - Governor Replacement Commissioning “,
Contech Services Ltd report dated February 2009.
SLIDE 23
v
www.globalskm.com www.globalskm.com
Thank You
ANY QUERIES: AMEHRTASH@GLOBALSKM.COM