Demonstration of Methodology 1. Determine Confidence of - - PowerPoint PPT Presentation

demonstration of
SMART_READER_LITE
LIVE PREVIEW

Demonstration of Methodology 1. Determine Confidence of - - PowerPoint PPT Presentation

Demonstration of Methodology 1. Determine Confidence of Hydrographic Holdings. Measuring Equipment Used High Confidence Age of Data Med. Confidence Surveying Low Confidence Technique Unassessed Other CAN and USA used Electronic


slide-1
SLIDE 1

1

Demonstration of Methodology

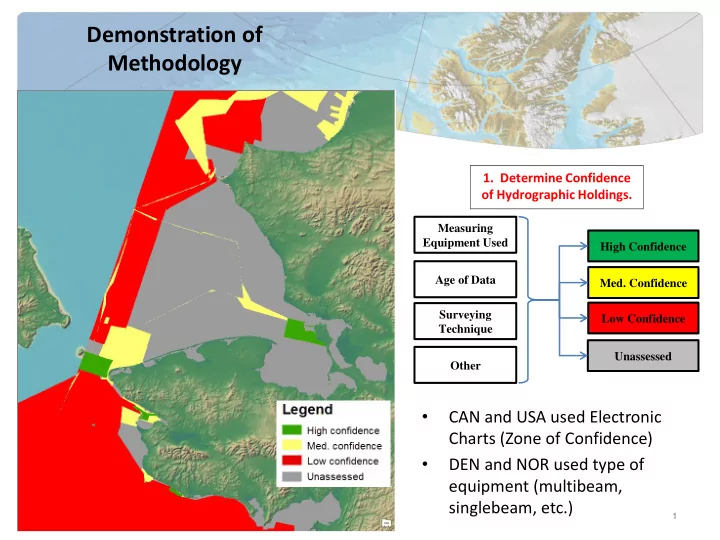
Age of Data Surveying Technique Other Measuring Equipment Used High Confidence

  • Med. Confidence

Low Confidence Unassessed

  • 1. Determine Confidence
  • f Hydrographic Holdings.
  • CAN and USA used Electronic

Charts (Zone of Confidence)

  • DEN and NOR used type of

equipment (multibeam, singlebeam, etc.)

slide-2
SLIDE 2

2 Shallow Mid-depth Deep Simple: 0-20m, 20-50m, 50+ m Depth + Seafloor Complexity

  • 2. Define Depth Bands based
  • n Seafloor Complexity.

Complex: 0-100m, 100-200m, 200+ m Simple: 0-20m 20-50m > 50m Complex: 0-100m 100-200m > 200m

  • The seafloor in this area is

considered “simple” (as opposed to the tectonically-active Aleutian chain).

  • All depths derived from the

International Bathymetric Chart

  • f the Arctic Ocean (IBCAO)

dataset.

Demonstration of Methodology

slide-3
SLIDE 3

3

Demonstration of Methodology

Low Concern

  • 3. Intersect Areas of Confidence

with Depth Areas to determine Potential Areas of Concern.

  • Med. Concern

High Concern Highest Concern (e.g. Higher Confidence and/or Deeper Depths) (e.g. Lower Confidence and/or Shallower Depths) Lowest Concern

  • The darker the color, the greater

the potential for concern…

  • However, the areas are only truly

concerning if they are being navigated by traffic.

slide-4
SLIDE 4

Presentation to PAME II 2014 4

Demonstration of Methodology

  • Side-by-side view showing the intersection between the Areas of Confidence (left) and

the Depth Areas (center) to yield the Potential Areas of Concern (right).

slide-5
SLIDE 5

5

Demonstration of Methodology

  • Notice there are three shallow

bays with an Unassessed confidence (marked with an *)…

  • While all three were previously

identified as potential areas of concern, only the center one experiences heavy traffic (thus, it could be increased in survey priority over the others).

  • 4. Extract “High Risk” Vessel Traffic Tracklines

and Intersect with Potential Areas of Concern.

Satellite-Observed Vessel Traffic Patterns Higher Risk Vessels:

  • Tankers
  • Cargo and Tugs
  • Passenger Vessels

Output:

  • Frequency of Vessels

transiting within Areas of Higher/Lower Concern…

  • … thus quantifying whether

region is adequately charted.

* *

*

slide-6
SLIDE 6

6

Demonstration of Methodology

  • Vessel tracks can now be parsed

based on how often they transit within any given depth- confidence combination to quantify the problem for any region.

  • See next slide for summary

tables…

  • 5. Compute Area Geometry of Potential Areas
  • f Concern and Linear Distance Traversed by

Vessel Traffic within each Area type.