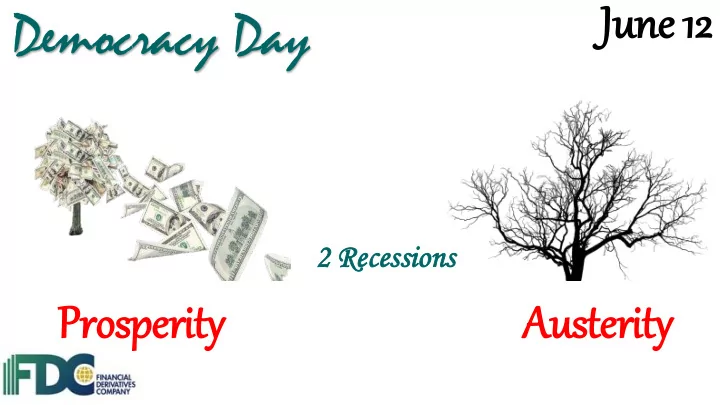

Ju June 12 12 Democracy Day 2 2 Re Recessi essions ons Austerity Prosperity
A Dec ecade of f Economic Swin ings (2 (2010 10-2020) 2014/ 4/20 2015 15 boom om Reco ecove very ry Slow recovery ry Global lobal shocks cks Rece ecess ssio ion n II Rece ecess ssio ion n I Prosp sperit ity Austerit ity Rec ecovery 2
External Reserves – External Debt Tri riumph = Buffers Tri rial Tri ribulation Huge ge Slim Sli Buffe Bu ffers No No Buf Buffers Buffer Buffers $48.88bn $14.43bn $5.11bn 2008 20 2020 20 20 2016 20 16 3
2015/16 2019/20 20 2008/09 20 Average GDP: 2.25% Average GDP: -1.56% Average GDP: 8% Avg oil price: $30pb Avg oil price: $40.68pb Avg oil price: $97pb Exchange rate: Exchange rate: Exchange rate: N360/$ N450/$ N200/$ N360/$ N118/$ Policymakers better Average buffers Huge buffers prepared but buffers thin Response slow Adjustments were External reserves: Situation worsened but swift to N155/$ 9.98% $36.48bn recovered External reserves: External reserves: $26bn $42bn
2008/09 20 2015/16 2019/20 Global GDP shock Global GDP Global GDP: 2.5% (-2%) projected to contract US bankruptcy rate Global GDP – limited by 3% (IMF) (up 40%) shock Subprime mortgage Covid shock No margin calls Stock market crisis A different world (-50%) Oil markets tanked Bank failures (Lehman 9.98% again Brothers, Bear Stearns)
Dow ownstream Pet etroleum 2015/16 5/16 2008/09 /09 2019/2 9/2020 20 Queues Queues No Queues N97/litr litre e N87/litre litre N121.5/li .5/litre tre ($0.82/li .82/litre) tre) ($0.44 .44/li /litre) tre) ($0.25 .25/li /litre) tre)
How you ou fa fare red in in th the la last st decade 2015 2008 2020 COVID-19 HIV Ebola 8
Economic Pic icture Source: EIU, NBS, FDC Think Tank 2010 2015 2020* GDP size ($’bn) 369.1 492.4 344.9 GDP growth (%) 7.8 2.7 -3.4 Inflation (%) (avg) 13.7 9.0 16.3 External reserves 32.35 29.07 36.0 ($’bn) Exchange rate 150.3 193.3 450.0 (N/$) Avg Balance of trade 31.5 -6.4 -1.4 ($’bn) Terms of trade 100 31.9 23.5 Minimum wage 5,500 18,000 30,000 (N/month) From Rec ecovery to to Dow ownturn - (T (The COVID ID)
Foo ood Basket % Change Commodities June 2020 June 2015 June 2018 (2018/2020) T omatoes (50kg) 20.00 15,000 25,000 12,000 Rice (50kg) 16,500 9,000 28,000 69.70 Pepper (bag) 8,000 7,000 13,000 62.5 Indomie (1 carton) 2,000 1,900 5.26 1,300 Yam (medium size) 800 1,900 1,500 21.05 2,900 2,300 3,400 Semovita (10kg) 17.24 Garri (50kg) Yellow 7,000 5,500 14,500 107.14 5 Neg egative, , 2 Posit itive
Con onsumer Bas asket is is Get etting Smal aller 2015 2015 2018 2018 2020 2020 Food inflation (%) 20 15.75 12.98 15 10 10 5 0 Jun'15 Jun'18 Jun'20* Source: NBS, FDC Think Tank
Non on-Food In Infla flation Spik iking! International school fees Transportation cost Air Ticket Medical bills No flights now but expected to
Sto tock Market In Inve vesto tors Lost t Thei eir Shir irts 2010 2010 2020 2020 Po Ponzi sc schemes als also o fail failed No o joy joy fro from MMM or or Swis iss gold old - Cra rash sh 2015 2015
Slo low & Pain inful GDP Economic Recovery 15
Lessons Learnt... ... If If Any Fiscal and external shocks will always exist for an oil dependent economy Investment is key Consumer led strategy has its drawbacks Monetary policy tools is inadequate to solve fiscal problems
Economic Recovery & Gro rowth ERGP I & II Challenges to address: Recessionary gap now at 11.8% Sub-optimal investment level Vulnerability to exogenous shocks Depleting external buffers
The In Inevitable Scrapping multiple exchange rates Adopting an efficient exchange rate adjustment mechanism Investment in road and rail transport Airport concessioning Blocking leakages Simplify tax administration Cost reflective electricity tariffs
The Maybe’s Lease/sale of idle assets Convert power sector loans to equity Shift subsidies from wasteful consumption to critical social infrastructure (health, education)
Dif ifferent V Vie iews of of N Nig igeria (2 (2020) • Growth to contract by - • Stagflation is expected 3.4% before recovering in • Naira devaluation will 2021 elevate inflation • Unified and flexible • Debt servicing costs to exchange rate should be jump expedited • Medium term focus should be on macroeconomic stability
Economic For orecast- EIU IU 2020 2021 2022 GDP($bn) 344.9 384.1 438.5 Private consumption ($bn) 278.4 308.2 342.8 Inflation (year end %) 18.1 13.2 10.5 M2 growth (%) 10.1 20.3 19.3 Exchange rate (year end N/$) 450.0 500.2 500.4 Oil production (mbpd) 1.54 1.60 1.62 Share of world investment flows (%) 0.18 0.26 0.29 Share of world exports (%) 0.24 0.25 0.31 Source: EIU, FDC Think-Tank
Outl tlook - Rec ecovery - Slo low But t Solid The new ERGP will be launched The economy will fall into a recession with growth of approx -5% in 2020 A U-shaped recovery will commence in Q2’2021 Inflation will spike above 15% before falling on higher output
Outl tlook - Rec ecovery - Slo low But t Solid The FGN will further liberalise factor prices (electricity & PMS) to enhance competitiveness The naira will be allowed to trade at its Real Effective Exchange Rate (REER)
Recommend
More recommend