
SLIDE 1
1 Powering Ahead with Singapore Petroleum
July 2008
2
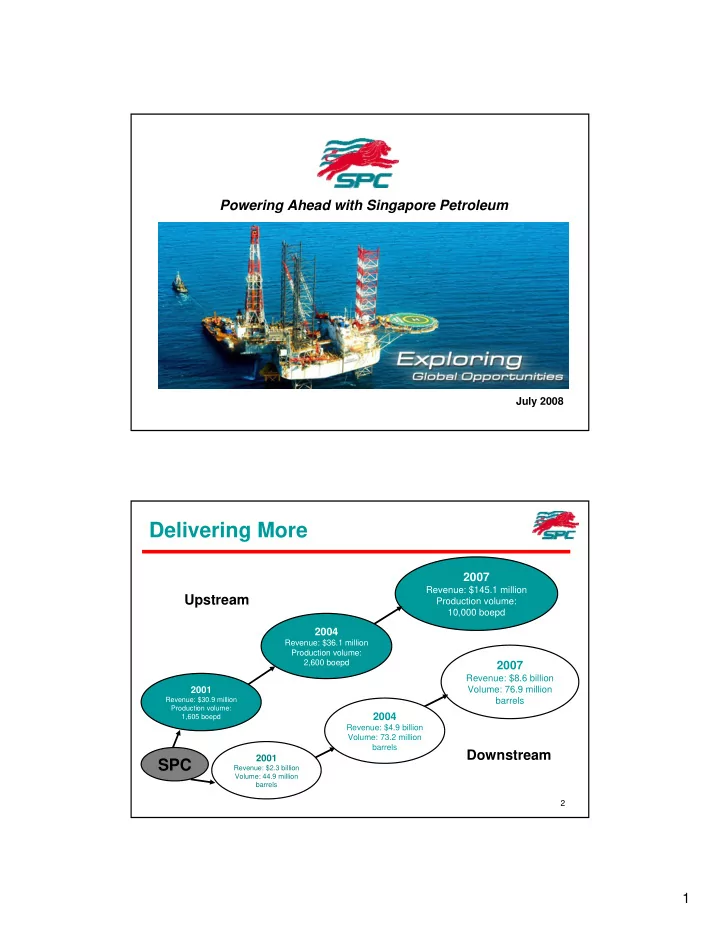
Delivering More
SPC
2007
Revenue: $145.1 million Production volume: 10,000 boepd
2007
Revenue: $8.6 billion Volume: 76.9 million barrels
Upstream Downstream
2004
Revenue: $36.1 million Production volume: 2,600 boepd
2004
Revenue: $4.9 billion Volume: 73.2 million barrels
2001
Revenue: $2.3 billion Volume: 44.9 million barrels
2001
Revenue: $30.9 million Production volume: 1,605 boepd