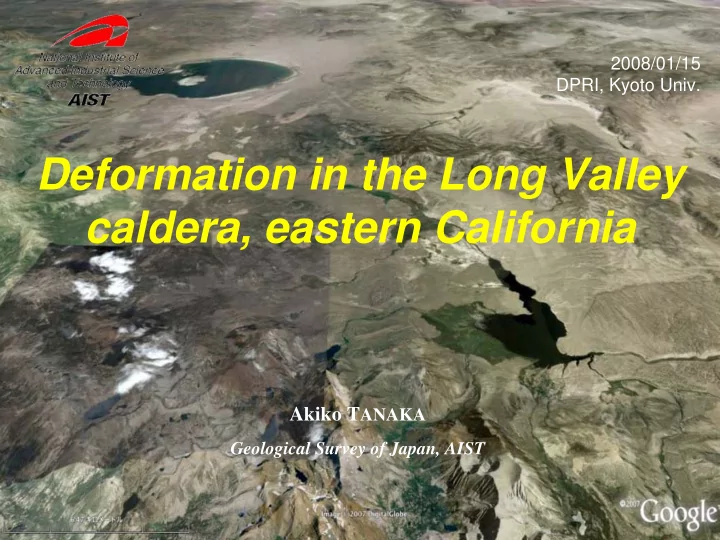

2008/01/15 DPRI, Kyoto Univ. Deformation in the Long Valley caldera, eastern California Akiko T ANAKA Geological Survey of Japan, AIST
Acknowledgements PIXEL (PALSAR Interferometry Consortium to Study our Evolving Land surface) ERSDAC (Earth Remote Sensing Data Analysis Center) The ownership of PALSAR data belongs to METI and JAXA.
Map of Long Valley Caldera Generalized geologic map of the Long Valley Caldera-Mono Lake region showing the distribution of principal volcanic units erupted in the past 2 million years together with major normal faults and epicenters of M>=1.2 earthquakes from 1978 through 2003. [Hill and Prejean, 2005] [Howle et al ., 2003]
General Location Map of the Long Valley area http://lvo.wr.usgs.gov/gallery/MapGallery.htm l
Map of Long Valley Caldera The resurgent dome is the broad, dome-shaped highland of post- caldera lava domes about 9 km in diameter that stands at the centre of the caldera, about 500 m above the surrounding lowlands that form the caldera ‘moat’. Mammoth Mountain is a cumulo- volcano formed by repeated eruptions of dacite and rhyodacite from vents on the southwest rim of the caldera 220 000 - 50 000 years ago (Hildreth, 2004). The map shows the levelling routes, the two-colour EDM geodetic network, the levelling sites occupied with GPS, and the gravity network. [Battaglia and Vasco, 2006]
A history of episodic resurgent dome inflation and recurring earthquake swarm activity Modified after Hill et al. [2003]
Changes in Distances Measurements since Sept 1984 Locations of baselines being measured with the two-color EDM and continuous GPS stations. For six baselines, the GPS data can be We have stopped using the two-color converted to length-changes and directly compared with those length changes measured by the two-color EDM. EDM in favor of continuous GPS! http://quake.usgs.gov/research/deformation/twocolor/lv_2col_proxy.html
Changes in Distances Measurements from the past year Locations of baselines being measured with the two-color EDM and continuous GPS stations. For six baselines, the GPS data can be converted to length-changes and directly compared with those length changes measured by the two-color EDM. http://quake.usgs.gov/research/deformation/twocolor/lv_2col_proxy.html
Inflating Resurgent Dome from 1992-1996 (ERS-1) July 1993-May1995 July 1992-May1996 Casa Diablo Geothermal Field ~ 5 cm Inflation and Deflation Thatcher and Massonnet [1997]
Inflating Resurgent Dome from 1996-1998: a Growing Blister in the Caldera ERS-1 InSAR images of LVC courtesy Mark Simons, Caltech
Deformation in Long Valley Caldera using Persistent scatterer analysis: PS versus leveling and GPS [Hooper and Zebker, 2007]
Inflating Resurgent Dome from 19930625-19960812 (JERS-1) ~ 5 cm Inflation and - ROI_PAC Deflation at Casa Diablo - DEM (NASA/JPL airborne SAR) geothermal field
070703-070818 (PALSAR) 75/216 FBDH SRTM DEM B perp. ~ 220 m Deflation at Casa Diablo geothermal field
070703-070818 (PALSAR) 74/216 FBDH B perp. ~ 220 m Deflation at Casa Diablo geothermal field ?
060815-0711 (PALSAR) 060815-060930 (PALSAR) 74/216 FBSH 74/216 FBSH B perp. > 2000 m B perp. ~ -220 m
Conclusions - JERS-1 interferogram (June 1993-August 1998) shows a small region of subsidence associated the Casa Diablo geothermal power plant, which is superimposed on a broad scale uplift/expansion of the resurgent dome. - PALSAR interferograms show no deformation of the resurgent dome as expected. However, it may show a small region of subsidence associated the Casa Diablo geothermal power plant.
Future Directions?: Dedicated and Planetary Satellites to date have not been optimized for InSAR. - A dedicated satellite able to make frequent and consistent observations. - Constellations of InSAR satellites in a variety of orbits allow near-real-time imaging. -> Shimada-san and/or Kodama-san.
Future Directions?: Dedicated and Planetary InSAR missions to Venus, Mars, Europa, or Titan could potentially reveal various deformational processes. Synthetic interferogram of tidal strain at crack on Europa (Possible Design for Europa SAR: S-band (13 cm), 1000 km orbit) [Sandwell et al ., 2004] critical baseline ~20 km Orbital contril ~ 5000m Galileo high-resolution image of a strike-slip region on Europa, compared with the San Andreas Fault at the same scale. Images are about 200km across. [http://es.ucsc.edu/~fnimmo/website/images.html]
Recommend
More recommend