
SLIDE 1
1
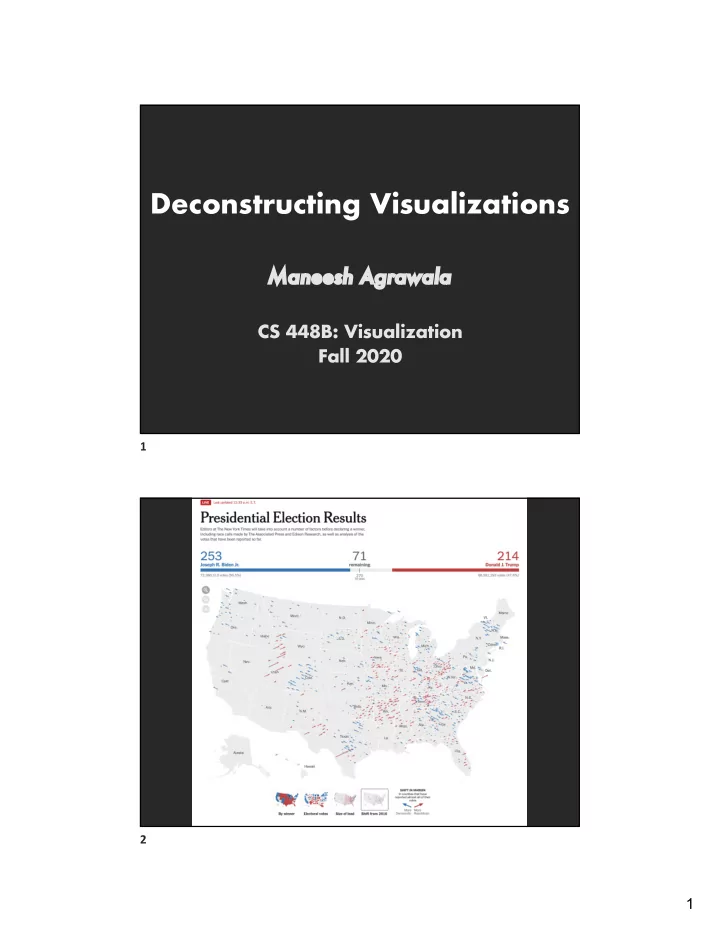
Deconstructing Visualizations
Ma Maneesh Agrawala
CS 448B: Visualization Fall 2020
1 2
Deconstructing Visualizations Ma Maneesh Agrawala CS 448B: - - PDF document
Deconstructing Visualizations Ma Maneesh Agrawala CS 448B: Visualization Fall 2020 1 2 1 Announcements 3 Final project Data analysis/explainer or conduct research I Data analysis : Analyze dataset in depth & make a visual explainer I
1
1 2
2
3
Data analysis/explainer or conduct research
I Data analysis: Analyze dataset in depth & make a visual explainer I Research: Pose problem, Implement creative solution
Deliverables
I Data analysis/explainer: Article with multiple interactive
visualizations
I Research: Implementation of solution and web-based demo if possible I Short video (2 min) demoing and explaining the project
Schedule
I Project proposal: Thu 10/29 I Design Review and Feedback: Tue 11/17 & Thu 11/19 I Final code and video: Sat 11/21 11:59pm
Grading
I Groups of up to 3 people, graded individually I Clearly report responsibilities of each member
4
3
5 6
4
Pixels are poor representation
Hard for machines to retrieve data 7 8
5
9
Pixels are poor representation
Hard for machines to retrieve data Hard for people to manipulate 10
6
Pixels are a poor representation of charts and graphs
Cannot index, search, manipulate or interact with the data
Goal: Re Reconstruct higher-le level l representation of charts and graphs that lets machines and people re redesign, re reuse and re revitalize them 11
12
7
Year Exports Imports 1700 170,000 300,000 1701 171,000 302,000 1702 176,000 303,000 1703 180,000 312,000 1704 187,000 319,000 … … …
Year à x-pos (Q) Exports à y-pos (Q) Imports à y-pos (Q) Exports à color (N) Imports à color (N) mark: lines
Data Marks Mappings
13
Disease Budget Aids 70.0% Alzheimer’s 5.0% Cardiovascular 1.1% Diabetes 4.8% Hepatitus B 4.1% Hepatitus C 3.8% Parkinson’ 6.0% Prostate 5.2%
Budget à angle (Q) Disease à color (N) mark: areas
Data Marks Mappings
14
8
Budget à length (Q) Disease à color (N) mark: lines
Disease Budget Aids 70.0% Alzheimer’s 5.0% Cardiovascular 1.1% Diabetes 4.8% Hepatitus B 4.1% Hepatitus C 3.8% Parkinson’ 6.0% Prostate 5.2%
Data Marks Mappings
15
Classification: Determine chart type Mark extraction: Retrieve graphical marks Data extraction: Retrieve underlying data table
16
16
9
17
18
10
19 Bar Charts Pie Charts Scatter Plots
20
11
21
22
12
23
24
13
25
26
14
Corpus: 667 charts, 5 chart types [Prasad 2007] Average Accuracy
[Prasad 2007] Multi-class SVM 84% ReVision: Multi-class SVM 88% ReVision: Binary SVM (yes/no for each chart type) 96%
27
http://vis.berkeley.edu/papers/revision
ReVision binary SVMs give 96% classification accuracy
28
15
29
Bar charts and pie charts only No shading or texture, 3D, stacked bars, or exploded pies
30
16
y-value x-value 50 A 25 B 4 C 75 D marks: lines
31
Find Foreground Rectangles Identify Orientation and Baseline Recover Bar Values Associate Labels with Bars
Extract Marks Extract Data
Scale: 2 pixels/unit
marks: lines y-value x-value 50 A 35 B 4 C 75 D
42
17
Fit Ellipse Using RNASAC Unroll Pie and Find Transitions Compute Area Percentages Associate Labels with Areas
Extract Marks Extract Data
marks: areas
percentage category 22.3 A 22.4 B 10.8 C 5.6 D 5.6 E 33.3 F
Scale: 50 pixels/percent
43
52 53 41 33 29 21 10 20 30 40 50 60 Bar Pie Number of Charts Total charts Mark extractions Data extractions
79% 56% 62% 40% 44
18
Average chart size: 342 x 452 pixels [Prasad 2007]
7.7% 4.6%
Bar Charts Pie Charts
45
46
19
Original Redesign
47
Original Redesign
48
20
Original Redesign #1
49
Original Redesign #1 Redesign #2
50
21
Additional Chart Types Handling Legends
52
Visual elements that are layered onto a chart to facilitate the perceptual and cognitive processes involved in chart reading
53
22
54
55
23
56
57
24
58
59
25
60
year money 2000 85 2001 78 2002 87 2003 90 2004 98 … … mark: lines
Most overlays only require access to marks
Reference structures (marks) Highlights (marks) Redundant encodings (marks and data) Summary statistics (marks) Annotations (marks) 61
26
How can we facilitate reading text and charts together?
62
63
27
64 Skepticism for capitalism is lowest in Brazil (22%), China (19%), Germany (29%) (although East Germans are less supportive than West Germans) and the U.S. (24%). Skepticism for free markets is highest in Mexico (60%) and Japan (60%).
65
28
Skepticism for capitalism is lowest in Brazil (22%), China (19%), Germany (29%) (although East Germans are less supportive than West Germans) and the U.S. (24%). Skepticism for free markets is highest in Mexico (60%) and Japan (60%).
66 Top earners have attracted more opprobrium as their salaries and the performance
in opposite directions. Europeans and Latin Americans tend to have similar attitudes to the rich; the Anglo-Saxon world is a bit more forgiving.
67
29
Top earners have attracted more opprobrium as their salaries and the performance
in opposite directions. Europeans and Latin Americans tend to have similar attitudes to the rich; the Anglo-Saxon world is a bit more forgiving.
68
Document segmentation Mark and data extraction Reference extraction Merge Split Select representative Cluster
Preprocessing Crowdsourcing Clustering and Merging
69
30
70
specified references
Clustered
0.1 0.2 0.3 0.4 0.5 0.6 0.7 0.8
All workers Passed gold and merged
71
31
deconID name type cost fill xPosition height
D3 Code D3 Chart Our Deconstruction
2 apple fruit 1.00 green 35 px 20 px
Data Marks
3 pear fruit 2.00 green 60 px 40 px 4 beef meat 5.00 red 85 px 100 px
Mappings Deconstructing and Restyling D3 Visualizations. Jonathan Harper and Maneesh Agrawala.
User Interface Software Technology (UIST) 2014.
Automatically convert D3 code into mapping based representation to enable redesign and style reuse
L
cost height type fill
C
area
L
cost
L
cost yPos
L
deconID xPos
73
country rate deconID Namibia 37.6 17 Macedonia, FYR 32.0 21 Armenia 28.6 25 Bosnia and Herzegovina 27.2 29 Lesotho 25.3 33 South Africa 24.7 37 Spain 20.1 41 Latvia 18.7 45 … … …
Deconstructing and Restyling D3 Visualizations. Jonathan Harper and Maneesh Agrawala.
User Interface Software Technology (UIST) 2014.
74
32
country rate deconID Namibia 37.6 17 Macedonia, FYR 32.0 21 Armenia 28.6 25 Bosnia and Herzegovina 27.2 29 Lesotho 25.3 33 South Africa 24.7 37 Spain 20.1 41 Latvia 18.7 45 … … …
Deconstructing and Restyling D3 Visualizations. Jonathan Harper and Maneesh Agrawala.
User Interface Software Technology (UIST) 2014.
75
Perceptual effectiveness? Visual aesthetics? Accessibility for vision impaired users?
Data Source Style Target Result
76
33
Data Source Style Target
Converting Basic D3 Charts into Reusable Style Templates. Jonathan Harper and Maneesh
77
Converting Basic D3 Charts into Reusable Style Templates. Jonathan Harper and Maneesh
78
34
Many specialized collections
Scientific: PLOS, JSTOR, ACM DL, … Web visualizations: D3, Processing, … News: New York Times, Pew research, …
How can deconstruction aid search?
Search by chart type, data type, marks, data, … Similarity search with inexact matching Query expansion
79
A chart is a collection of mappings between data and marks We can reconstruct this representation from chart bitmaps Such reconstruction enables redesign, reuse and revitalization
80