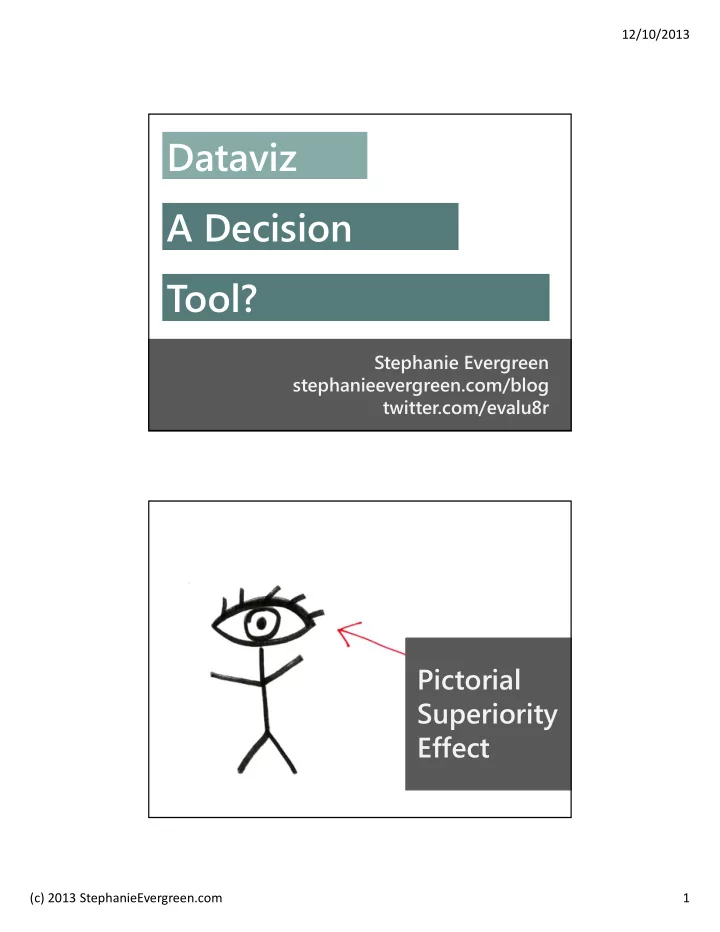

12/10/2013 Dataviz A Decision Tool? Stephanie Evergreen stephanieevergreen.com/blog twitter.com/evalu8r Pictorial Superiority Effect (c) 2013 StephanieEvergreen.com 1
12/10/2013 tiger? oops? (c) 2013 StephanieEvergreen.com 2
12/10/2013 working memory organize & emphasize (c) 2013 StephanieEvergreen.com 3
12/10/2013 long term memory Simplify & Emphasize (c) 2013 StephanieEvergreen.com 4
12/10/2013 Before & After (c) 2013 StephanieEvergreen.com 5
12/10/2013 Evaluator Breakfast Preferences Eggs Pancakes Cereal Don't eat breakfast Fruit salad Bagel Just a pile of bacon Evaluator Breakfast Preferences Just a pile of bacon Bagel Eggs Pancakes Fruit salad Cereal Don't eat breakfast Don't eat breakfast Cereal Fruit salad Pancakes Bagel Eggs Just a pile of bacon 0% 10% 20% 30% (c) 2013 StephanieEvergreen.com 6
12/10/2013 Evaluator Breakfast Preferences Just a pile of bacon Bagel Eggs Fruit salad Pancakes Cereal Don't eat breakfast Don't eat breakfast Cereal Fruit salad Bagel Pancakes Just a pile of bacon Eggs 0% 5% 10% 15% 20% 25% Evaluator Breakfast Preferences Just a pile of bacon Bagel Fruit salad Don't eat breakfast Cereal Pancakes Eggs 0% 5% 10% 15% 20% 25% (c) 2013 StephanieEvergreen.com 7
12/10/2013 Evaluator Breakfast Preferences Eggs Just a pile of bacon Cereal Pancakes Don't eat breakfast Bagel Fruit salad 0% 5% 10% 15% 20% 25% Evaluator Breakfast Preferences Eggs Just a pile of bacon Cereal Pancakes Don't eat breakfast Bagel Fruit salad 0% 5% 10% 15% 20% 25% (c) 2013 StephanieEvergreen.com 8
12/10/2013 Evaluator Breakfast Preferences Eggs Just a pile of bacon Cereal Pancakes Don't eat breakfast Bagel Fruit salad 0% 5% 10% 15% 20% 25% Evaluator Breakfast Preferences Eggs Just a pile of bacon Cereal Pancakes Don't eat breakfast Bagel Fruit salad 0% 5% 10% 15% 20% 25% (c) 2013 StephanieEvergreen.com 9
12/10/2013 Evaluator Breakfast Preferences Eggs Just a pile of bacon Cereal Pancakes Don't eat breakfast Bagel Fruit salad 0% 5% 10% 15% 20% 25% Evaluator Breakfast Preferences Eggs Just a pile of bacon Cereal Pancakes Don't eat breakfast Bagel Fruit salad 0% 5% 10% 15% 20% 25% (c) 2013 StephanieEvergreen.com 10
12/10/2013 Evaluator Breakfast Preferences One in ten fellow evaluators do not consume adequate energy for their first meal of the day. Eggs Just a pile of bacon Cereal Pancakes Don't eat breakfast Bagel Fruit salad 0% 5% 10% 15% 20% 25% Evaluator Breakfast Preferences One in ten fellow evaluators do not consume adequate energy for their first meal of the day. Eggs 23% Just a pile of bacon 21% Cereal 16% Pancakes 14% Don't eat breakfast 10% Bagel 8% Fruit salad 8% (c) 2013 StephanieEvergreen.com 11
12/10/2013 before & after don’t (c) 2013 StephanieEvergreen.com 12
12/10/2013 Order Evaluator Breakfast Preferences One in ten fellow evaluators do not consume adequate energy for their first meal of the day. Eggs 23% Just a pile of bacon 21% Cereal 16% Pancakes 14% Don't eat breakfast 10% Bagel 8% Fruit salad 8% (c) 2013 StephanieEvergreen.com 13
12/10/2013 Program Survey Results Strongly Agree Agree Disagree Strongly Disagree The program was worth my time. 68% 26% My coach fit my needs. 64% 21% I would recommend this program to others. 52% 35% Total violent crime in Michigan metropolitan counties in 2007 Barry 42 Bay 41 Berrien 134 Calhoun 82 Cass 34 Clinton 12 Eaton 138 Genesee 56 Ingham 126 Ionia 28 Jackson 117 Kent 345 Lapeer 51 Livingston 50 Macomb 390 Monroe 171 Newaygo 69 Oakland 417 (c) 2013 StephanieEvergreen.com 14
12/10/2013 Legend & Label (c) 2013 StephanieEvergreen.com 15
12/10/2013 (c) 2013 StephanieEvergreen.com 16
12/10/2013 (c) 2013 StephanieEvergreen.com 17
12/10/2013 Comparing Racial Composition White Native Hawaiian or Other Pacific Islander Hispanic/Latino Public School City Black or African American Asian American Indian or Alaska Native 0 20 40 60 80 100 (c) 2013 StephanieEvergreen.com 18
12/10/2013 Comparing Racial Composition White Native Hawaiian/ Other PI Hispanic/Latino Black/ Public School African American City Asian American Indian/ Alaska Native 0 20 40 60 80 100 Text (c) 2013 StephanieEvergreen.com 19
12/10/2013 Graduation rates are slowly increasing. But many are still lost in the system. 70% Graduated 60% 50% 40% 30% 20% Dropped Out Removed 10% Unknown 0% 2009 2010 2011 2012 (c) 2013 StephanieEvergreen.com 20
12/10/2013 Color (c) 2013 StephanieEvergreen.com 21
12/10/2013 Grade 4 Science is up from last year, but still in an overall decline. 100% K Readiness 80% Gr 9 MEAP 60% Gr 4 Science 40% Graduation 20% 0% 2000 2012 (c) 2013 StephanieEvergreen.com 22
12/10/2013 9 th Grade College Expectations Strongly Strongly Disagree Neutral Agree Disagree Agree I expect to go to 1.5% 5.4% 5.2% 31.2% 56.7% college My parents expect me 8.2% 7.7% 14.9% 46.3% 22.9% to go to college My teachers expect 1.8% 24.7% 28.3% 31.1% 14.1% me to go to college In 2011 9 th grade expectations to attend college rose by 8% (c) 2013 StephanieEvergreen.com 23
12/10/2013 Comparing Racial Composition The composition of the public schools does not reflect the racial makeup of the metropolitan city in which the schools are located. Black/ African American White Hispanic/Latino Asian Public School American Indian/ City Alaska Native Native Hawaiian/ Other PI 0 20 40 60 80 Comparing Racial Composition The composition of the public schools does not reflect the racial makeup of the metropolitan city in which the schools are located. Black/ African American White Hispanic/Latino Asian Public School American Indian/ City Alaska Native Native Hawaiian/ Other PI 0 20 40 60 80 (c) 2013 StephanieEvergreen.com 24
12/10/2013 Comparing Racial Composition The composition of the public schools does not reflect the racial makeup of the metropolitan city in which the schools are located. Black/ African American White Hispanic/Latino Asian Public School American Indian/ City Alaska Native Native Hawaiian/ Other PI 0 20 40 60 80 (c) 2013 StephanieEvergreen.com 25
12/10/2013 colorbrewer2.org (c) 2013 StephanieEvergreen.com 26
12/10/2013 colorblindness Putting it All Together (c) 2013 StephanieEvergreen.com 27
12/10/2013 opposingviews.com (c) 2013 StephanieEvergreen.com 28
12/10/2013 (c) 2013 StephanieEvergreen.com 29
12/10/2013 Questions? (c) 2013 StephanieEvergreen.com 30
12/10/2013 Handout StephanieEvergreen.com/book (c) 2013 StephanieEvergreen.com 31
12/10/2013 Smart Data Visualization Stephanie Evergreen stephanieevergreen.com/blog twitter.com/evalu8r (c) 2013 StephanieEvergreen.com 32
Recommend
More recommend