
SLIDE 1
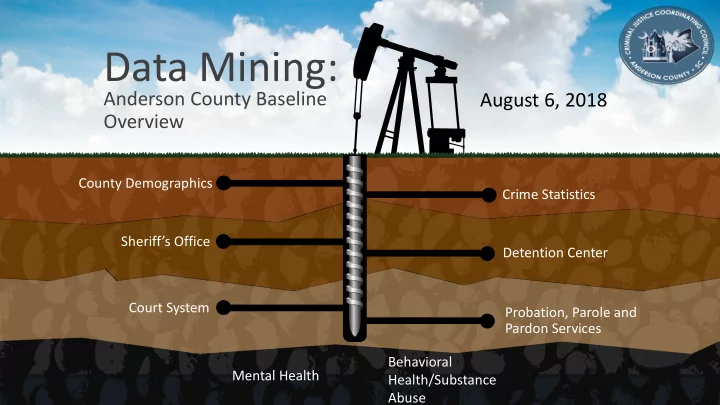
Data Mining:
Anderson County Baseline Overview
County Demographics Sheriff’s Office Court System Crime Statistics Detention Center Probation, Parole and Pardon Services
August 6, 2018
Mental Health Behavioral Health/Substance Abuse
Data Mining: Anderson County Baseline August 6, 2018 Overview - - PowerPoint PPT Presentation
Data Mining: Anderson County Baseline August 6, 2018 Overview County Demographics Crime Statistics Sheriffs Office Detention Center Court System Probation, Parole and Pardon Services Behavioral Mental Health Health/Substance Abuse
Anderson County Baseline Overview
County Demographics Sheriff’s Office Court System Crime Statistics Detention Center Probation, Parole and Pardon Services
August 6, 2018
Mental Health Behavioral Health/Substance Abuse
Anderson County Info/Demographics
0.3 1 1.2 3.8 16.3 77.42010 Census Demographics
American Indian Asian Two or More Races Hispanic/Latino Black/African American White
Male: 48.1% Female: 51.9% Population: Approx. 200,000 757 sq. miles Veterans: Approx. 14,000 Bachelor’s Degree or Higher, 25+: 20% Persons in Poverty: 15.4% Median Household Income: $43,518 Data Retrieved from: https://www.census.gov/quickfacts/fact/table/andersoncountysouthcarolina/PST045217
Communication Center 9-1-1
100000 200000 300000 400000 500000 600000 2016 2017158255 150916 392719 377495
Incoming Calls
911 Calls NonEmergency Calls
528411
290000 300000 310000 320000 330000 340000 350000 360000 3700002016 2017
318325 360437
Service (Actionable) Calls
550974
4 % 13 %
Data reported by the Anderson County Sheriff’s Office Communications Center.
2016 2017 2018*
18135 18148 10464 4178 4649 2774 Incidents Arrests .07 %
10 %
metrics are trending above 2017 for the same time period. Incidents Arrests 4% 7% Data provided by the Anderson County Sheriff’s Office Records and Judicial Orders Division.
Crime Statistics: “Major Crimes”
1,560, 19% 4,042, 50% 732, 9% 22, 0% 918, 11% 16, 0% 66, 1% 91, 1% 745, 9%
2016: FBI UCR Crime Trends for Anderson County
Burglary Larceny/Theft Motor Vehicle Theft Arson Violent Crime Murder Rape Robbery Aggrevated Assault
https://ucr.fbi.gov/crime-in-the-u.s/2016/crime-in-the-u.s.-2016/tables/table-8/table-8-state-cuts/south-carolina.xls
Data Retrieved from:
Offense % Change
Murder 19 8
Aggravated Assault 754 583
Forcible Sex Offense 151 141
Arson 22 27 5 22.7 Burglary 1416 1022
Larceny 2717 2710
Motor Vehicle Theft 753 639
Robbery 93 103 10 10.8 Drug Violations 600 1111 511 85.2
2016 YTD 2017 YTD Change Offense % Change
Murder 5 5 Aggravated Assault 333 294
Forcible Sex Offense 72 54
Arson 17 19 2 11.8 Burglary 592 574
Larceny 1362 1435 73 5.4 Motor Vehicle Theft 341 358 17 5 Robbery 62 46
Drug Violations 600 694 94 15.7
2017 YTD 2018 YTD Change This report shows all reportable criminal offenses for 2018 Year-To-Date compared to the same period in 2017. Data provided by the Anderson County Sheriff's Office. Report Date: July 8 - July 14) This report shows all reportable criminal offenses for 2017 Year-To-Date compared to the same period in 2016. Data provided by the Anderson County Sheriff's Office. Report Date: Dec. 24- Dec. 30)
Data provided by the Anderson County Sheriff’s Office Records and Judicial Orders Division.
65% 35%
2018: ACSO Tickets
January 1- June 30 Custodial (Arrest) Non-Custodial "Ticket and Release"
50 100 150 200 250 300 350 400 450 500 16-25 26-35 36-45 46+396 483 356 358
2018: ACSO Tickets
January 1 - June 30
30% 22% 23% 25%
363 258 249 186 65 59 58 57 52 50 49 44 31 30 27 10 5
2018: ACSO Ticket Charges
Custodial and Non-Custodial January 1 - June 30
Data provided by the Anderson County Sheriff’s Office Records and Judicial Orders Division.
1956: Open Doors*
1997: Addition to Increase Capacity
2001: Female POD 2004: Trustee Dormitory
2006: Remodel previous Female POD into Booking/In-Take Area Operational Capacity: 206 Rated Capacity: 253/257
Development Planning/ Construction: 5-10 yrs.
Detention Center: Demographics
3263 3593 1189 1305
Detention Center: Gender
Male Female
2016 2017
2 6 1203 107 9 19 3103 5 10 1184 118 12 2 19 3545
Detention Center Race/Ethnicity 2016 and 2017
14 %
1 % 9 . 7 5 % Data provided by the Anderson County Sheriff’s Office Jail Tracker Management System. 1.5 %
4446 4884
Anderson County Detention Center: Unique Individuals
2016 2017
9.8 %
6000 6100 6200 6300 6400 6500 6600 6700 68006275 6716 Anderson County Detention Center: Bookings
2016 2017
7% Data provided by the Anderson County Sheriff’s Office Jail Tracker Management System.
Top Charges 2016
100 200 300 400 500 600 700 800 900 FAILURE TO APPEAR AFTER RELEASE FOR A MISDEMEANOR VIOLATION OF PROBATION (USED BY PPP) POSSESSION <1 GRAM OF METH OR COCAINE BASE PUBLIC DISORDERLY CONDUCT NON SUPPORT FAILURE TO APPEAR AFTER RELEASE FOR A FELONY DRIVING UNDER SUSPENSION HOLD FOR ANOTHER AGENCY SHOPLIFTING <$2000 DUI <10- 1ST OFFENSEDetention Center
500 1000 1500 2000 2500 3000 3500 4000 4500 5000MISDEMEANOR FELONY
28% 72% Data provided by the Anderson County Sheriff’s Office Jail Tracker Management System.
Top Charges 2017
100 200 300 400 500 600 700 FAILURE TO APPEAR AFTER RELEASE FOR A MISDEMEANOR VIOLATION OF PROBATION (USED BY PPP) POSSESSION <1 GRAM OF METH OR COCAINE BASE- 1ST OFFENSE GENERAL SESSION COMMITMENT PUBLIC DISORDERLY CONDUCT FAILURE TO APPEAR AFTER RELEASE FOR A FELONY NON SUPPORT HOLD FOR ANOTHER AGENCY DRIVING UNDER SUSPENSION POSSESSION OTHER CONTROLLED SUBSTANCE IN SCHEDULE I TO V- 1ST OFFENSEDetention Center
1000 2000 3000 4000 5000 6000 MISDEMEANOR FELONY29% 71% Data provided by the Anderson County Sheriff’s Office Jail Tracker Management System.
Top Charges 2018 (Jan.-May)
20 40 60 80 100 120 140 160 180 VIOLATION OF PROBATION POSSESSION <1 GRAM ICE/CRACK COCAINE POSSESSION <28 GRAMS OF MARIJUANA PUBLIC DISORDERLY CONDUCT CHILDREN/SUPP. OBLIGATION TODetention Center
200 400 600 800 1000 1200 1400 1600 1800 200067% 33%
SHIFT- SC Supreme Court Administrative Order: FTA/Bench Warrants
Data provided by the Anderson County Sheriff’s Office Jail Tracker Management System.
Detention Center Overcrowding
350 350 359 352 367 383 403 383 387 402 408 382 125% 130% 135% 140% 145% 150% 155% 160% 165% 50 100 150 200 250 300 350 400 4502016 Average Monthly Population
Average Count Rated Capacity Capacity %
424 468 448 459 457 440 426 426 436 452 418 418 150% 155% 160% 165% 170% 175% 180% 185% 190% 50 100 150 200 250 300 350 400 450 5002017 Average Monthly Population
Average Count Rated Capacity Capacity %
“Peak and Valley” Average. Data retrieved from Anderson County Sheriff’s Office Jail Tracker Management System.
395 427 397 398 401 419 403 375 370 412
Detention Center: Average Daily Count/Operational View
Average Count Rated Capacity
400 156% Capacity
What can you expect at the Detention Center today?
Data reported from the Anderson County Sheriff’s Office Jail Tracker Management System for Sept. 2017-June 2018.
2016 2017
289 285 73 82
At-Risk: Booked 3-4 Times (Minus Expunged) Familiar: Booked 5+ (Minus Expunged)
Data provided by the Anderson County Sheriff’s Office Crime Analysis Unit.
Detention Center: Average Length of Stay
Data provided by the Anderson County Sheriff’s Office Jail Tracker Management System.
10 20 30 40 50 60 AVERAGE LENGTH OF STAY ALOS: MISDEMEANOR ALOS: FELONY23 14 51 22 11 50
Detention Center: Length of Stay
2016 2017
Mental Health and Substance Abuse Considerations
54
44
62
348
659
37
13
Arresting and Detention Officer
Data provided by the Anderson County Sheriff’s Office Jail Tracker Management System. Average combines data from 2016 and 2017.
Mental Health and Substance Abuse Considerations
Self Report
TAKE DRUGS?
ATTEMPTED SUICIDE?
Data provided by the Anderson County Sheriff’s Office Jail Tracker Management System. Data reflects responses from 2016 and 2017.
Mental Health
Anderson Oconee Pickens Mental Health Center:
3,086 Clients Served Overall
(July 2016-June 2017)
50 100 150 200 2502016 2017
167 213
Detention Center Consults First Time Evaluation/Assessment
28 %
110 115 120 125 130 135 140 145 1502016 2017
126 150
Incarcerated Persons Served
19 %
Data provided by the Anderson Oconee Pickens Mental Health Center.
2015 2016 2017 2018
464 588 916 1144
Drug Case Submissions
147 %
For the above chart, reported years reflect Jan.1-Aug. 1 respectively.
2018 Drug-Related Offenses YTD*
5 10 15 20 25 30EMS: Naloxone
20%
Data provided from Anderson County Emergency Medical Services via DHEC Reporting. Data reported from the Anderson County Sheriff’s Office Crime Analysis Unit.
Substance Analysis Results
50 100 150 200 2502015 2016 2017 2018
Cocaine
200 400 600 800 1000 12002015 2016 2017 2018
Meth/Amph.
50 100 150 200 2502015 2016 2017 2018
Opiates
50 100 150 200 2502015 2016 2017 2018
Rx Antidepressants
50 100 150 200 250 3002015 2016 2017 2018
All Other Substances
Data provided by the Anderson Oconee Forensics Laboratory. 2018 Results:
Drugs: How Do we Compare?
Data retrieved from: http://www.sled.sc.gov/documents/CrimeReporting
South Carolina Anderson County Anderson County Filings 2014/2015 0%
3,334 2015/2016 6%
25% 4,177
2016/2017 5%
11%
4,622
Filings % Change Yr. to Yr.
Time Period 0-365 Days 366+ Days 7/1/14-4/30/15 79% 20% (503 Cases) 7/1/15-4/30/16 84% 16% (491 Cases) 7/1/16-4/30/17
75%
25% (1,086 Cases)
7/1/17-4/30/18
75%
25% (1,045 Cases)
Pending Docket Benchmark
Note: The South Carolina Judicial Department set the benchmark
2017 Approximately 4,400 Cases Disposed and 2,800 Unique Individuals.
Data retrieved and compiled from www.sccourts.org
2016 19,337
Cases Disposed
2017
19,289
Cases Disposed
Data provided by Anderson County Summary Court.
Family and Probate Courts
Time Period 0-365 Days 366+ Days 7/1/14-4/30/15
87% 13%
7/1/15-4/30/16
86% 14%
7/1/16-4/30/17
80% 20%
7/1/17-4/30/18
86% 14%
Family Court: Anderson County
Pending Docket Benchmark Note: The South Carolina Judicial Department set the benchmark of 80% of pending docket, at minimum, be 365 days or less.
100 200 300 400 500 600 700 800 900 10002016 2017
963 868 763 604
Probate Court: Mental Health
Caseload Orders (Action Taken)79% 70%
Data retrieved and compiled from www.sccourts.org
Probation, Parole, and Pardon Services
FY 2016 FY 2017 Admissions (%) Probation 84 90 Parole 16 3 Other 7 Age (%) < 24 17 19 25+ 83 81 Gender (%) Female 25 25 Male 75 75 Race (%) Black 24 27 Other 2 2 White 74 71 FY 2016 FY 2017 Offense (%) Violent 12 10 Non Violent 88 90 Supervision (%) Standard 60 59 Medium 8 10 High 28 27 Intensive 1 1 Sex Offender 4 3 Domestic Violence Closure Type (%) Successful 71 75 Unsuccessful 29 25
https://www.dppps.sc.gov/content/download/142961/3254185 /file/Annual+Statistical+Report++FY2017.pdf https://www.dppps.sc.gov/content/download/109508/249917 9/file/Annual+Statistical+Report++FY2016.pdf
2016 Active Cases: 2,437 2017 Active Cases: 2,283
Future Digging…
by Agency, by Charge (To Include Municipalities)
Data
Non-Conviction Rates by Charge
Services/Programming
Adverse Childhood Experiences (ACES)
for Law Enforcement
Substance Use Disorders, and Non- Permanent Housing
Open Forum/Discussion
Any data not represented that would be informative?
Contact Information
Casey Collins 864.309.6063 ccollins@andersonsheriff.com