Data Acquisition Chapter 2 Data Acquisition 1 st step: get data - - PowerPoint PPT Presentation

data acquisition
SMART_READER_LITE
LIVE PREVIEW

Data Acquisition Chapter 2 Data Acquisition 1 st step: get data - - PowerPoint PPT Presentation

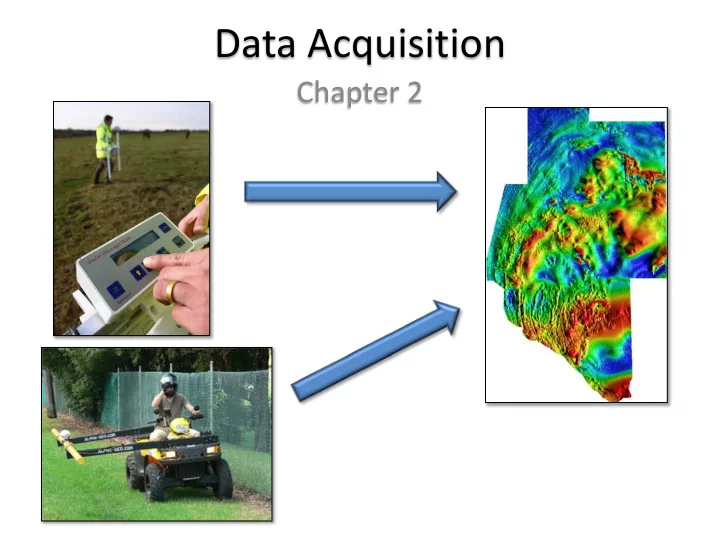
Data Acquisition Chapter 2 Data Acquisition 1 st step: get data Usually data gathered by some geophysical device Most surveys are comprised of linear traverses or transects Typically constant data spacing Perpendicular to


slide-1
SLIDE 1

Data Acquisition

Chapter 2

slide-2
SLIDE 2

Data Acquisition

  • 1st step: get data

– Usually data gathered by some geophysical device – Most surveys are comprised of linear traverses or transects

  • Typically constant data spacing
  • Perpendicular to target
  • Resolution based on target
  • Best for elongated targets

– When the data is plotted (after various calculations have been made): Profile

slide-3
SLIDE 3

Grids

  • When transects are combined

a grid can be formed.

– Good for round or blob-shaped targets

  • Or if target geometry is unknown

– Useful for making contour maps – Allows transects to be created in multiple directions

slide-4
SLIDE 4

Data Reduction

  • Often the raw data collected is

not useful.

– Data must be converted to a useful form

  • Removing the unwanted signals in

data: Reduction

  • Targets are often recognized by

an “anomaly” in the data

– Values are above or below the surrounding data averages.

  • Not all geophysical targets

produce spatial anomalies.

– E.g. seismic refraction produces travel time curves  depth to interfaces

  • Also a type of reduction.
slide-5
SLIDE 5

Signal and Noise

  • Even after data is reduced, a

profile may not reveal a clear anomaly due to noise.

– Noise: Unwanted fluctuations in measured data.

  • May be spatial or temporal
  • What causes noise?

– Signal: The data you want, i.e. no noise.

  • Noise can be removed using

mathematical techniques

– Stacking – Fourier Analysis – Signal Processing

Magnetic or Gravity profile

slide-6
SLIDE 6

Stacking

  • Stacking is useful when:

– Noise is random – Signal is weak – Instrument is not sensitive

  • If noise is random

– Take multiple readings – Sum the readings – Noise cancels out

  • Destructive Interference

– Signal should add

  • Constructive Interference
  • Stacking improves signal to

noise ratio

– Commonly used with numerous techniques.

slide-7
SLIDE 7

Resolution

  • Even if you have a good

signal to noise ratio, detection of your target depends on your resolution.

– Know what you are looking for before you begin – Know the limits of your data resolution

slide-8
SLIDE 8

Modeling

  • Most geophysical data is

twice removed from actual geological information

– Reduced data is modeled

  • Models

– Aim to describe a specific behavior or process – Are only as complex as the data allows

  • Occam’s Razor: “Entities

should not be multiplied unnecessarily”

slide-9
SLIDE 9

Model Types

  • In the most basic sense models come in two flavors:

– Forward model

  • Given some set of variables, what is the result.
  • I.e. you input the “cause” and some “effect” is produced

– Inverse model

  • Given some measurements, what caused them
  • You know the “effect”, try to determine the “cause”
  • Often involves mathematical versions of “guess and check”

Depth = D Fault Slip GPS Station Motions

slide-10
SLIDE 10

Model Types

  • Models also come in several flavors

based on technique

– Conceptual Model

  • Models an idea…no math/physical parts

– Analog Model

  • A tangible model “scaled” to reproduce

geologic phenomena

– Empirical Model

  • Based on trends in data

– Analytical Model

  • Solves an equation
  • Usually deals with simple systems

– Numerical Model

  • Computer-based approximations to an

equation.

– Thousands, millions, or billions of calculations

  • Can handle complex systems.

Analog Model Empirical Model

From Wells & Coppersmith 1994

slide-11
SLIDE 11

Non-Uniqueness of Models

  • Typically, multiple models

can fit data

– So any given model is non- unique – Distinguish between models based on

  • Match with geologic data
  • Model with least

parameters (most simple)

  • Data has limited resolution

– Surveys must be finite – “Blurs the picture” – Omission of detail emphasizes key features

slide-12
SLIDE 12

Geologic Interpretation

  • After data is collected and

modeling is complete the results must be interpreted into the geological context.

  • Use all available data.

– Don’t only look, when you can hear and touch!

  • Interpretations are also typically

non-unique

– Many geologic materials have similar properties. – Best interpretations use all available data, geologic, geophysical, chemical, etc… Material Density (gm/cm3) Air ~0 Water 1 Sediments 1.7-2.3 Sandstone 2.0-2.6 Shale 2.0-2.7 Limestone 2.5-2.8 Granite 2.5-2.8 Basalts 2.7-3.1 Metamorphic Rocks 2.6-3.0