SLIDE 1 1
Danger on wheels: characteristics of traffic fatality in Brazilian State capitals*
Ana Carolina Soares Bertho1 Larissa Quaglio Xavier2 Júlia Cristo Santos Marques2 Abstract Traffic accidents are a worldwide concern. In order to reduce the growing traffic violence, the United Nations created the Decade of Action for Road Safety 2011-2020. In Brazil, in 2013, over 42 thousand people died in traffic accidents and more than 173,000 people were injured in accidents; many were left with permanent sequelae. This study assesses how traffic accidents are affecting population in all Brazilian State capitals and in the Federal District, analyzing rates by sex, age and type of accident, analyzing the influence of per capita household income, population density and motorization rates. Traffic fatality data from Brazilian State capitals were obtained from Mortality Information System, available in Datasus website. Population and income data were taken from 2010 Demographic Census. Results show that traffic fatality rates for males are up to seven times greater than rates for females. No capital had female rates higher than 16 deaths per 100,000 inhabitants. On the other hand, no capital had male rates below 16 deaths per 100,000 inhabitants. Death rates are related to the number of motorcycles per 1,000 inhabitants and negatively related to population density. Although most of the victims were young people, mortality rates are higher for the elderly.
1 Researcher and Professor, National School of Statistical Sciences (ENCE), Brazilian Institute of
Geography and Statistics (IBGE) – carolbertho@gmail.com
2 Undergraduate Student, National School of Statistical Sciences (ENCE), Brazilian Institute of
Geography and Statistics (IBGE). * This paper is part of a project supported by CNPq (process 456539/2014-0).
SLIDE 2 2
Introduction Nearly 1.2 million people die each year due to traffic accidents (WHO, 2015). The number of people who die in traffic accidents in Brazil has been rising since the beginning
- f the year 2000 and, in 2013, more than 42 thousand Brazilians died due to this cause.
Using mortality data from 2008, Chandran and colleagues (2013) showed that men had a reduction of approximately 0.8 years of life expectancy at birth due to deaths due to traffic accidents, while women had life expectancy reduced 0.2 years. The high mortality of men due to traffic accidents compared to women is not exclusive of Brazil. According to the Global Status Report on Road Safety 2015, 3 out of 4 road deaths are among men (WHO, 2015). During the last decade, the motorcycle has become a popular means of transportation among Brazilian young adults. Considered as more flexible in traffic and cheaper than the car, it has become an important asset to combat unemployment, since it enabled people to have access to jobs far from their homes and served as a working tool for people, who work as couriers. However, what seemed to be a solution has become a problem for it made users vulnerable to traffic accidents leading to fatalities (Silva et al., 2011). In developed countries, the automobile also became hegemonic, but there are differences when comparing with developing countries. In Europe, most of the population has private vehicles, but makes rational use of them, using public transport or non- motorized means. In the United States, cities are fully geared and designed for automobile use, with large roads for fast transit (called freeways) and few options for public transportation or bike paths (Vasconcellos; Carvalho; Pereira, 2011). Since 1990s, many studies (Söderlund; Zwi, 1995; Van Beeck; Kopitz; Cropper, 2005) showed the relationship between the decline in mortality from traffic accidents and improving economic conditions in developed countries. The association between increase in motorization rates (number of vehicles per thousand inhabitants) and growth in mortality from accidents is common. Nonetheless, these authors showed that at first, with the improvement of economic conditions of the population, there was an increase in the vehicle fleet and in mortality by traffic accidents. However, after reaching a certain per capita income level (which varies between US $ 3,000 and US $ 8,600 , according to the author), the mortality rates due to this cause began to decline, although the subsequent rate of motorization increased.
SLIDE 3 3
In Brazil, the car turned into "a mean of reproduction of the new middle class generated by the process of income concentration" (Vasconcellos, 2000, p.116). Without it, individuals could not satisfactorily perform the necessary displacements to do their everyday activities. For this reason, this author states that the purchase and use of the car cannot be seen as a personal decision, but rather a class decision. Since the choice for motorcycle use is conditioned by structural, mainly social, and economic issues, it would be a mistake to ignore the role of these aspects in the victimization of individuals. Based on those discussions, this study assesses how traffic accidents are affecting population in each Brazilian State capital, analyzing rates by sex, age and type of accident, analyzing the influence of per capita household income and other social characteristics
Materials and Methods In this study, data from the 26 Brazilian state capitals were used, in addition to the Federal District (Brasília). Traffic fatality data from those cities were obtained from Mortality Information System, which is processed, organized and published by the Health Ministry. To avoid random effects, the calculated averages of the deaths of the years 2009, 2010 and 2011 were used. Population data to estimate mortality rates were
- btained from the 2010 Demographic Census. To calculate specific mortality rates by
age, victims were aggregated in five age groups: 0 to 14 years; 15 to 29 years; 30 to 44 years; 45 to 59 years; 60 years and more. This specification is important because even though typically most victims were between 15 and 29 years-old (not only in Brazil, but also in other countries), this information is strongly influenced by the age composition of the population. Considering rates is an option to avoid bias. This evaluation is also important, because there are studies (Souza el al., 2003) that show that lethality, which means the risk of death after some injury, is three times higher for people aged 60 years
- r more compared to other age groups.
In order to analyze types of victims based on the means of transport used at the time they had the accident, they were aggregated in four groups from ICD-10 (International Classification of Diseases 10th Revision): Pedestrian injured in transport accident (V01-V09); pedal cyclist injured in transport accident (V10-V19); motorcycle rider (V20-V29); other victims (V30-V89), including occupants and drivers of cars, buses, trucks and pickup trucks. During the analysis process, it was necessary to add another group. A brief discussion about that issue is presented in “results and discussion”.
SLIDE 4
4
Demographic Census 2010 was used also to obtain the average household income per capita and population density for each capital. The data on the number of vehicles to calculate number of vehicles per 1,000 inhabitants and number of motorcycles per 1,000 inhabitants were obtained from the National Department of Traffic (Denatran). Results and Discussion Results show that traffic fatality rates for males are up to seven times greater than rates for females. No capital had female rates higher than 16 deaths per 100,000 inhabitants (Graphic 1). On the other hand, no capital had male rates below 16 deaths per 100,000 inhabitants. Porto Velho, the capital of the Rondônia State, presented higher rates for both men and women (57.3 and 15.5 deaths per 100,000 inhabitants, respectively). Capitals of the Northern Region of Brazil occupy the three first positions in mortality rate ranking by deaths due to traffic accidents. However, it is not possible to identify a defined pattern of mortality according to the Region. Salvador, in Bahia State, was the capital with the lowest rates (16.6 and 3.7 deaths per 100,000 inhabitants, respectively). Nevertheless, even in this case, the difference between the sexes is maintained, with 4.5 men for each woman who died because of traffic accidents. Graph 1 –Traffic fatality rates by sex per 100,000 inhabitants – Brazilian State capitals, 2010 Source: SIM/SVS/MS; Demographic Census 2010 (IBGE).
SLIDE 5
5
A possible explanation for this difference could be that men drive more (cars, motorcycles, buses and trucks) than women do. If this hypothesis were true, the gap between sex rates would decrease or even disappear when considering pedestrian victims, since even those who use cars are pedestrians at some moment when realizing their everyday mobility. Graph 2 shows that this hypothesis is not confirmed. In almost all capitals, male rates are much higher than female rates. The only exception is Rio Branco, but in this case, the poor quality of information does not allow making affirmations. This point will be further explored below. Graph 2 – Traffic fatality rates by sex per 100,000 inhabitants – Pedestrians – Brazilian State capitals, 2010 Source: SIM/SVS/MS; Demographic Census 2010 (IBGE). That difference between males and females confirms the results found in the literature. In order to investigate the association between increase in motorization rates and growth in mortality by traffic accidents, the next analysis starts exploring the link between average household income per capita and number of vehicles per 1,000 inhabitants (Graph 3). It was observed that there is a strong Pearson´s correlation among those variables: 0.642 (significant at the 0.01 level 2-tailed). This effect could be expected, since cars are an important durable good, intended by many individuals and families. “The car we might
SLIDE 6 6
say is a way of life and not just a transport system for getting from one place to another” (URRY, 2007, p.115) Graph 3 – Average household income per capita and vehicles per 1,000 inhabitants – Brazilians State capitals, 2010 Source: DENATRAN; Demographic Census 2010 (IBGE). This result is not repeated when considering the number of motorcycles per 1,000
- inhabitants. In this case, the correlation was not significant. The explanation can be that
usually motorcycle is perceived as an option to a public transport that is often very expensive (Vasconcellos; Carvalho; Pereira, 2011). So, unlike cars, the motorcycle does not automatically represent improvement in economic conditions. There is also no correlation between per capita household income and the mortality rate by traffic accidents per 100,000 inhabitants. But when considering number of motorcycles per 1,000 inhabitants and the mortality rate per 1,000 inhabitants (Graph 4), there is a strong Person´s correlation: 0.823 (significant at the 0.01 level 2-tailed). It means that in Brazilian state capitals, the more motorcycles running on the roads, the more deaths from accidents. Although mortality rates include all types of victims in addition to motorcyclists (pedestrians and occupants
- f other vehicles), accidents involving motorcycles cause deaths not only of those who
are driving them, but also of other road users.
SLIDE 7
7
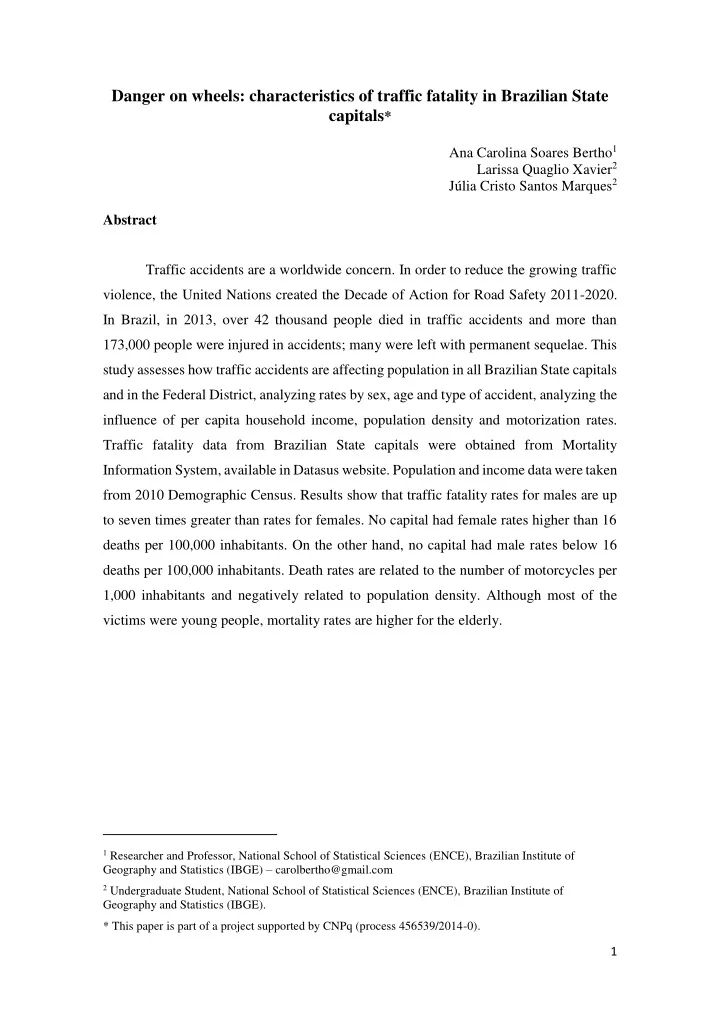
Graph 4 - Mortality rate by traffic accidents per 1,000 inhabitants and number of motorcycles per 1,000 inhabitants – Brazilian State Capitals, 2010 Source: SIM/SVS/MS; DENATRAN; Demographic Census 2010 (IBGE). The last association analyzed was between population density (inhabitants per km2 and mortality rate per 100,000 inhabitants (Graph 5). Graph 5 – Population density (inhabitants per km2) and mortality rate per 100,000 inhabitants – Brazilian State capitals, 2010 Source: SIM/SVS/MS; Demographic Census 2010 (IBGE).
y = 0,1681x + 7,2399 5 10 15 20 25 30 35 40 20 40 60 80 100 120 140 160 Mortality rate per 100,000 inhabitants Motorcycles per 1,000 inhabitants
SLIDE 8 8
Distances travelled have been used as an exposition measure. This information is not available for this data set, but Blaizot et al. (2013) found that non-dense areas present a higher risk of injuries to cyclists. The explanation is that in those areas, cyclists could develop a higher average speed compared to dense areas. Pearson´s correlation between those variables was -0.487 (significant at the 0.01 level 2-tailed), showing that denser areas have lower rates. Blaizot et al. (2013) could be broadened to explain this result. However, in addition it is important to highlight that in non-dense areas the distances travelled are higher, which could increase exposure to the risk of death due to traffic accidents. Analysis of victims by type and age groups The analysis of type of victims who died as a result of traffic accidents is important to define public policies to avoid them. Firstly, victims were divided into four groups, as explained previously: pedestrians; cyclists; motorcycle riders; and other victims. However, it was observed that in some capitals, the last group was oversized because of those deaths classified under code V89 – Motor or nonmotor-vehicle accident, type of vehicle unspecified. This is indicative of poor quality of information. For this reason, a fifth group was created, grouping all deaths under code V89. Graph 6 shows that in two capitals (Macapá and Rio Branco) the perceptual of unspecified victims reaches more than 90%; in Porto Velho and Maceió, the victims classified as V89 were 68.5%; and in only 11 capitals the perceptual of unspecified victims was under 15%. In order to avoid bias involving this variable, this analysis will evaluate only those capitals (Belém, Rio de Janeiro, Fortaleza, São Paulo, Porto Alegre, Curitiba, Vitória, Brasília, Aracaju, Cuiabá and Campo Grande). In six of those 11 capitals with good quality data, most of the victims were
- pedestrians. Belém stands out as the capital with the higher participation of pedestrians
among victims (80.2%). However, it is among those that have the lowest mortality rates (as can be seen in Graph 1). Motorcyclists stand out in Cuiabá, Campo Grande and Aracaju, accounting for 37.5%, 37.2% and 35.3% of all victims of accidents. These capitals are among the 10 with highest rates of mortality due to traffic accidents.
SLIDE 9
9
Graph 6 – Percentage of deaths due to traffic accidents by type of victims – Brazilian State capitals, 2010 Source: SIM/SVS/MS. Unfortunately, because of the bad quality of data in most capitals, it is not possible to go any further with this variable. There is also a strong limitation to analyze type of victims by sex and age groups. For this reason, the last analysis explores mortality rates by sex and age groups. Literature highlights the facts that young people aged 15 to 29 are the majority of victims of traffic accidents. According to the World Health Organization, this is the first cause of death among people in this age group (WHO, 2015). However, this information is influenced by the age structure of the population. In order to reduce this effect, mortality rates were calculated by age groups. Since those similar results were found in all capitals, Graph 7 shows only the three first capitals with higher total mortality rates for males and females. Even with the large incidence of deaths among young people, the mortality rates by traffic accidents, in general are higher for the last age group. This result corroborates with the fact that, in case of traffic accident, lethality can be much higher for people aged 60 years or more. This graph also highlights the fact that, except in the first age group, there is a huge difference between male and female rates in all ages.
SLIDE 10 10
Graph 7 – Mortality rates by age groups and sex per 100,000 inhabitants – selected Brazilian State capitals, 2010 Source: SIM/SVS/MS; Demographic Census 2010 (IBGE). Conclusions As a summary, the present study presented a brief analysis of mortality by traffic accidents in Brazilian State capitals and the Federal District. Comparing mortality by sex, in all cities studied, male rates were higher than female rates. This result was repeated when considering only pedestrians. Crossing variables, it was found that average income per capita is moderately correlated with number of vehicles per 100,000 inhabitants. However, that correlation is not observed with motorcycles. One explanation could be that to buy a motorcycle is rather a way of avoiding public transport than a sign of increase in purchasing power. Nevertheless, the number of motorcycles per 100,000 population is correlated with the mortality rate by traffic accidents. Population density was also significant when related to mortality rates, but in this case, the correlation was negative, revealing that denser cities presented a lower risk of
- deaths. One interpretation is that in non-dense areas, drivers could develop higher speeds,
increasing the risk. However, a more in-depth analysis is necessary to prove this hypothesis.
SLIDE 11
11
Regarding the type of victims, there is an important gap in data, because in some capitals the majority of accidents are classified under code V89 from ICD-10, which does not specify the type of victim that died. Analyzing victims by age groups it was possible to verify that, although in absolute numbers the majority of victims are young people, mortality rates are higher for the elderly (above 60 years). The correlation between number of motorcycles per 1,000 inhabitants and mortality rates reveal that the subsidy for the purchase of motorcycles, maintained for years by the Brazilian federal government, have dramatic consequences. The sources of data showed a high potential, because they allow that the methodology be replied to other geographic areas. However, there are strong limitations imposed by the bad quality of data related to type of victims. Without knowing who is dying more due to traffic accidents, it is difficult to define public policies for avoiding those deaths. References BLAIZOT, S.; PAPON, F.; HADDAKK, M.M.; AMOROS, E. Injury incidence rates of cyclists compared to pedestrians, car occupants and powered two-wheeler riders, using medical registry and mobility data, Rhône County, France. Accident Analysis and Prevention, 58:35-45, 2013. CHANDRAN, A.; KAHN, G.; SOUSA, T.; PECHANSKY, F.; BISHAI, D.M.; HYDER, A.A. Impact of road traffic deaths on expected years of life lost and reduction in life expectancy in Brazil. Demography, 50:229-236, 2013. KOPITZ, E.; CROPPER, M. Traffic fatalities and economic growth. Accident Analysis and Prevention, 37:169-178, 2005. SILVA, P.H.N.V.; LIMA, M.L.C.; MOREIRA, R.S.; SOUZA, W.V.; CABRAL, A.P.S. Estudo espacial da mortalidade por acidentes de motocicleta em Pernambuco. Revista de Saúde Pública, 45(2): 409-15, 2011. SÖDERLUND, N.; ZWI, A.B. Traffic-related mortality in industrialized and less developed countries. Bulletin of the World Health Organization, 73(2):175-182, 1995. <http://www.ncbi.nlm.nih.gov/pmc/articles/PMC2486752/pdf/bullwho004060043.pdf>. Access in: 20 Nov. 2016.
SLIDE 12 12
SOUZA, R.K.T.; SOARES, D.F.P.P.; MATHIAS, T.A.F.; ANDRADE, O.G.; SANTANA, R.G. Idosos vítimas e acidentes de trânsito: aspectos epidemiológicos e impacto na sua vida cotidiana. Acta Scientiarum. Health Sciences, 25(1): 19-25, 2003. URRY, J. Mobilities. Cambridge: Polity Press, 2007. VAN BEECK, E. F.; BORSBOOM, G.J.J.; MACKENBACH, J.P. Economic development and traffic accident mortality in the industrialized world, 1962-1990. International Journal
Epidemiology, 29, p.503-509, 2000. In: < http://repub.eur.nl/res/pub/9388/10869323.pdf>. Access in: 12 nov. 2016. VASCONCELLOS, E.A.; CARVALHO, C.H.R.; PEREIRA, R.H.M. Transporte e mobilidade urbana. Textos para Discussão CEPAL-IPEA, 34. Brasília, DF: CEPAL. Escritório no Brasil/IPEA, 2011. 74p. _____________. Transporte urbano nos países em desenvolvimento: reflexões e
- propostas. 3.ed. São Paulo: Annablume, 2000. 284p.
WHO - WORLD HEALTH ORGANIZATION. Global status report on road safety. Geneva, 2015. In: <http://www.who.int/violence_injury_prevention/road_safety_status/2015/en/>. Access in: 15 sep. 2017.