
SLIDE 1
11/21/2011 1
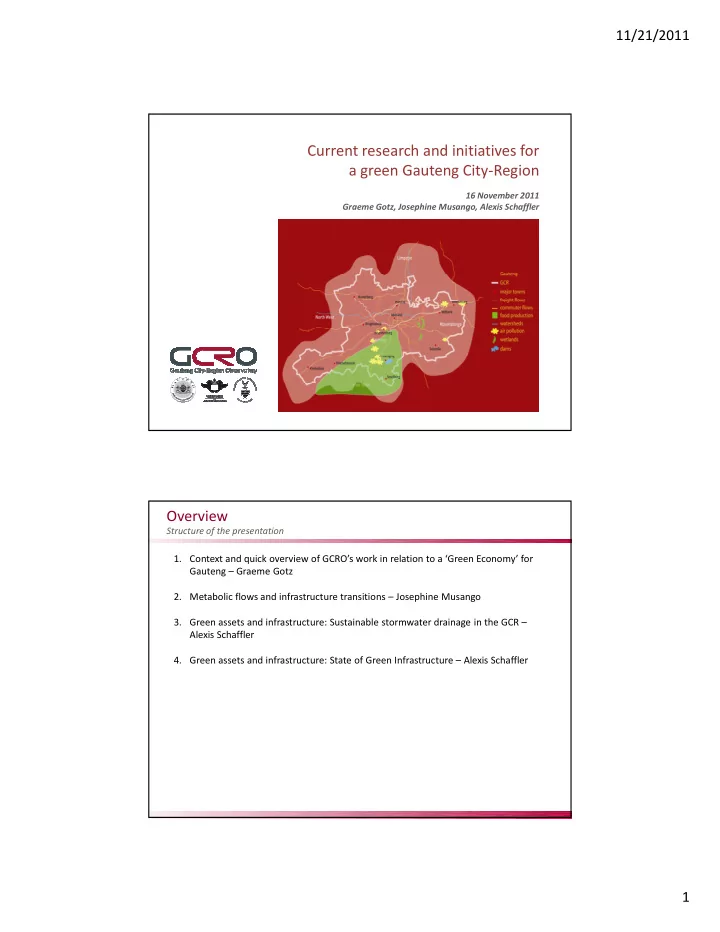
Current research and initiatives for a green Gauteng City-Region
16 November 2011 Graeme Gotz, Josephine Musango, Alexis Schaffler
- 1. Context and quick overview of GCRO’s work in relation to a ‘Green Economy’ for
Gauteng – Graeme Gotz
- 2. Metabolic flows and infrastructure transitions – Josephine Musango
- 3. Green assets and infrastructure: Sustainable stormwater drainage in the GCR –
Alexis Schaffler
- 4. Green assets and infrastructure: State of Green Infrastructure – Alexis Schaffler