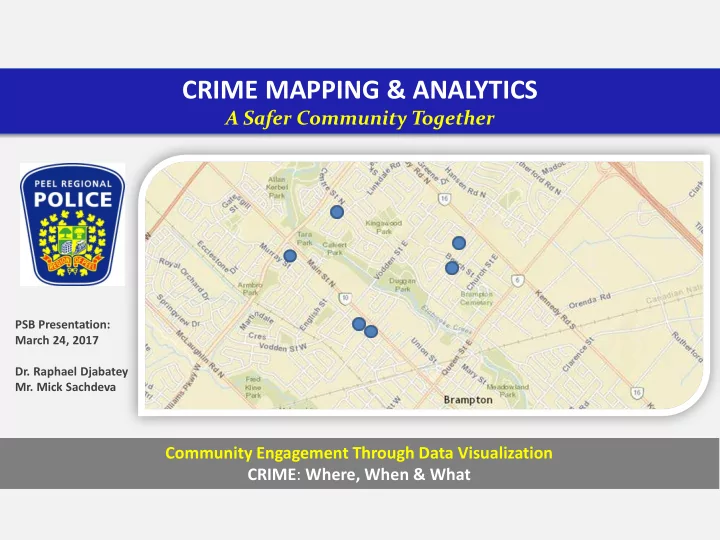
SLIDE 1 CRIME MAPPING & ANALYTICS
A Safer Community Together
Community Engagement Through Data Visualization CRIME: Where, When & What
PSB Presentation: March 24, 2017
- Dr. Raphael Djabatey
- Mr. Mick Sachdeva
SLIDE 2
- In response to growing public interest in, and request for crime statistics.
- The more informed the public are, the more engaged they are in tackling community safety
issues, and the more action they will take to support the police.
- Developed with inputs from various stakeholders and community partners:
- Safe City Mississauga,
- Brampton Safe City,
- Neighbourhood Watch,
- PRP Crime Prevention,
- Information & Privacy Unit,
- Corporate Communication.
- The mapping application was designed, developed and deployed using only our internal
resources cost effectiveness, easy customization and control of data.
- Strike balance between victim’s privacy and the public’s right to know about incidents
affecting their communities.
- Similar mapping applications deployed by other law enforcement agencies across Canada.
CRIME MAPPING & ANALYTICS
A Safer Community Together
SLIDE 3 CRIME MAPPING & ANALYTICS
A Safer Community Together
CMG Approved Proposal in 2009 Mapping Application was developed in 2011 Mapping Application was presented and approved by PSB in Jan 2012 Mapping Application went live
SLIDE 4
- This is interactive system for residents to become more aware of crime
trends and public safety issues in their neighborhoods.
- The 7 crime types considered for mapping are:
- Homicide
- Robbery
- Muggings
- Break-and-Enter
- Auto Theft
- Theft From Vehicle
- Mischief.
- Users can display crime incidents for the past week or one month.
- Crime map is updated daily to show new incidents.
- Users can map crime locations by street, neighborhood, municipal ward
- r postal code.
CRIME MAPPING & ANALYTICS
A Safer Community Together
SLIDE 5
- Query results will show date of incident, block location and type of the incident.
- Users can display satellite view of the incident locations.
- Users can display landmark locations such as police stations, malls, parks and
commercial centers.
- Benefits of web publishing of crime maps and statistics:
- enhance transparency,
- support community engagement,
- promote community interest in neighborhood safety,
- promote public confidence in crime statistics by providing prompt and
accurate information
- reducing time span for the public to gain access to the information
- As the needs change and technology improves, we are hoping to adapt the
application appropriately to address public concerns and issues.
CRIME MAPPING & ANALYTICS
A Safer Community Together
SLIDE 6
- On average, there are about 27,000
annual visits to the crime mapping
- website. An average of about 2,200
active visitors per month.
- About 75% of visitors are being new
visitors and 25% are returning visitors.
- About 78% of the users access the
mapping application from their desktop computers while 22% did so using their mobile devices.
- The trend is gradually shifting towards
the use of mobile device to access the mapping application.
CRIME MAPPING & ANALYTICS
A Safer Community Together
SLIDE 7
- As a results, we intend to transition to a more robust, advanced mobile,
tablet-based, dashboard environment which provides up-to-date snapshots
CRIME MAPPING & ANALYTICS
A Safer Community Together
neighborhood crime statistics
SLIDE 8
CRIME MAPPING & ANALYTICS
A Safer Community Together
SLIDE 9
CRIME MAPPING & ANALYTICS
A Safer Community Together
HOME PANEL
SLIDE 10
CRIME MAPPING & ANALYTICS
A Safer Community Together
One Week Snapshot
SLIDE 11
CRIME MAPPING & ANALYTICS
A Safer Community Together
One Month Snapshot
SLIDE 12
CRIME MAPPING & ANALYTICS
A Safer Community Together
One Month Snapshot
SLIDE 13
CRIME MAPPING & ANALYTICS
A Safer Community Together
Street Level Snapshot
SLIDE 14
CRIME MAPPING & ANALYTICS
A Safer Community Together
Municipal Ward
SLIDE 15
CRIME MAPPING & ANALYTICS
A Safer Community Together
Public Safety Security Privacy Community Engagement Transparency Accountability
SLIDE 16 CRIME MAPPING & ANALYTICS
A Safer Community Together
- Internal capabilities to deploy robust analytics
- Using many leading technologies and methodologies
– Descriptive statistics – Inferential Statistics – SPSS – SQL Server Analytics – GeoCortex/ESRI
- Change business processes to facilitate analytics
- Moving from providing information to providing insight
- Delivering the right insight to the right personnel at the right time to supplement
and facilitate the decision making process
SLIDE 17
CRIME MAPPING & ANALYTICS
A Safer Community Together
SLIDE 18 CRIME MAPPING & ANALYTICS
A Safer Community Together
Community Engagement Through Data Visualization CRIME: Where, When & What
Thank You