
SLIDE 1
Investor Presentation Sale Of Distribution
June 26, 2019
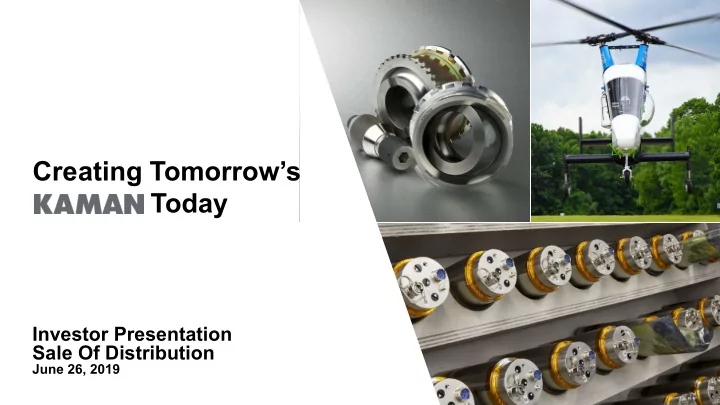
Creating Tomorrows Today Investor Presentation Sale Of - - PowerPoint PPT Presentation
Creating Tomorrows Today Investor Presentation Sale Of Distribution June 26, 2019 Forward Looking Statements FORWARD-LOOKING STATEMENTS This presentation includes "forward looking statements" relating to the announced
June 26, 2019
FORWARD-LOOKING STATEMENTS
This presentation includes "forward looking statements" relating to the announced transactions and future operations of the Company, which can be identified by the use
“would,” “could,” and other words of similar meaning in connection with a discussion of the proposed transaction or future operating or financial performance or events. Forward-looking statements also may be included in other publicly available documents issued by the Company and in oral statements made by our officers and representatives from time to time. These statements are based on assumptions currently believed to be valid but involve significant risks and uncertainties, many of which are beyond our control, which could cause our actual results to differ from those expressed in the forward looking statements. Such risks and uncertainties include, among
with respect to the Hart-Scott-Rodino Antitrust Improvements Act and other applicable antitrust laws in a timely manner; the timing of consummation of the announced transactions; the ability to implement the anticipated business plans following closing and achieve anticipated benefits and savings; the ability of the parties to secure required third party consents; the ability of the Purchasers to secure the equity and debt financing required to consummate the announced transaction; and future and estimated revenues, earnings, cash flow, charges and expenditures. Additional risks and uncertainties that could cause our actual results to differ from those expressed in the forward looking statements are identified in our reports filed with the SEC, including our Quarterly Reports on Form 10-Q, our Annual Reports on Form 10-K, and our Current Reports on Form 8-K. The forward looking statements included in this presentation are made only as of the date of this presentation, and the Company does not undertake any obligation to update the forward looking statements to reflect subsequent events or circumstances. Non-GAAP Figures Management believes that the Non-GAAP financial measures (i.e. financial measures that are not computed in accordance with Generally Accepted Accounting Principles) identified by an asterisk (*) used in this presentation or in other disclosures provide important perspectives into the Company's ongoing business performance. The Company does not intend for the information to be considered in isolation or as a substitute for the related GAAP measures. Other companies may define the measures differently. Reconciliations from GAAP measures to the Non-GAAP measures are presented herein.
Littlejohn & Co. for $700.0 million
Kaman seeks to build a leading engineered solutions product portfolio through a combination of R&D driven
M&A with a focus on maximizing total shareholder return.
1945
1997
Divested Kaman Sciences to ITT Industries
2019
Sale of Kaman Distribution to Littlejohn & Co.
1945
Kaman Aircraft Corporation founded as a Helicopter company
1950 1960 1970 2019
1970s
Launched Distribution and grew business through various acquisitions
1960s
and Kaman Music
Sciences out of Kaman Nuclear, AviDyne, Kaman Systems Centers, and SEA
1980s
Entered the fuzing business
1980 1990 2000
1950s
Founded Kaman Nuclear for diversification
2010
2007
Divested Kaman Music to Fender Musical Instruments
2015
Expanded our engineered product
acquisition of GRW and Extex
Differentiated Products Growth through Innovation Strategic Capital Allocation Focus on Cost Savings Technologically differentiated product offering supported by strong end markets. Accelerate internal investments driving growth through innovative products and technologies. Invest in strategic expansion
Evaluate cost structure for efficiencies and savings. Expected annualized savings of $15 - $20 million.
QTD YTD QTD TTM March 29, December 31, March 30, March 29, Distribution Segment (in thousands) 2019 2018 2018 2019 GAAP Operating Income $12,697 $51,529 $11,834 $52,392 Restructuring and severance
Adjusted Operating Income a $12,697 $52,184 $11,834 $53,047 Depreciation and Amortization b 3,892 14,154 3,506 14,540 Segment Adjusted EBITDA a + b $16,589 $66,338 $15,340 $67,587 Valuation Multiple Purchase price $700,000 $700,000 Segment Adjusted EBITDA $66,338 $67,587 Multiple 10.6x 10.4x
Adjusted Operating Income is defined as operating income, less items that are not indicative of the operating performance of the Company's segments or corporate function for the period presented. Segment Adjusted EBITDA is defined as Adjusted Operating Income plus Depreciation and Amortization. Management uses these measures to evaluate performance period over period, to analyze underlying trends in our businesses and to assess their performance relative to their competitors. We believe that this information is useful for investors and financial institutions seeking to analyze and compare companies on the basis of operating performance.