
SLIDE 1
Cranes are used to assemble a turbine at Northlands Mont Louis wind - - PowerPoint PPT Presentation
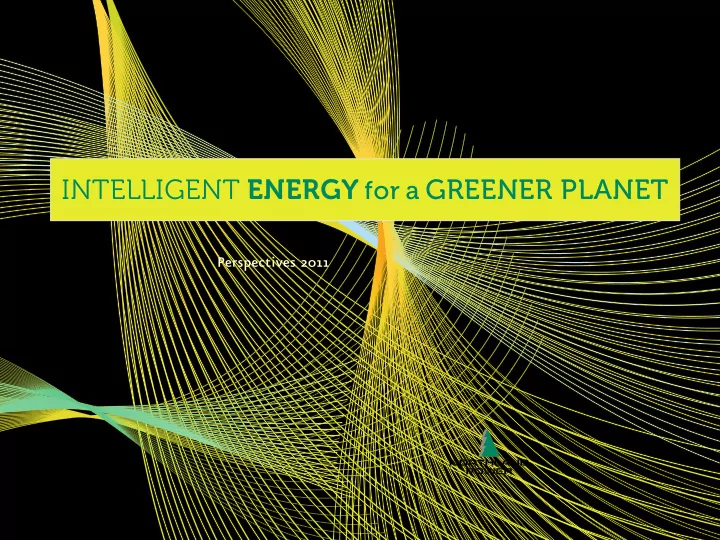
INTELLIGENT ENERGY for a GREENER PLANET Perspectives 2011 Cranes are used to assemble a turbine at Northlands Mont Louis wind farm, one of three major new facilities under construction at the close of 2010. This report highlights
Cranes are used to assemble a turbine at Northland’s Mont Louis wind farm,
construction at the close of 2010.
This report highlights Northland Power Income Fund’s significant events in 2009 and 2010 and management’s plans for the future. Northland’s annual report, including consolidated financial statements and management’s discussion and analysis, is available on the company’s site, www.northlandpower.ca. Forward-Looking Statements The contents of this document contain forward-looking statements based on assumptions management considered reasonable when it was prepared
forward-looking statements for reasons including, but not limited to, those described in the “Risks and Uncertainties” section of the company’s 2010 annual report. For these reasons, readers are cautioned against relying on forward-looking statements in making investment decisions.
31 2
›
8
›
14 › 24 › 2
›
2 8
›
Northland Power develops, owns, and operates facilities that produce and sell clean and green power.
1
Northland Power’s intelligent energy leverages our experience and expertise to create sustainable value for customers, shareholders, communities and employees – and a greener future for our planet.
What does that mean? For us, it’s several things:
needs, policies and opportunities
energy with the lowest possible impact and carbon footprint
to develop more effjcient solutions – such as the demand-responsive combined heat and power plant we opened last year in Thorold
Marmora as an opportunity to develop pumped storage that will shift energy production from
technologies to focus on promising new areas, such as TREK low-impact hydro technology
managing risk, amortizing assets, upgrading our equipment, improving our processes and evaluating
and profjtable for years to come
2
Perspectives 2011 › JAMES C. TEMERTY
Northland breaks new ground – again
In many ways, 2010 continued a remarkable run for Northland
fund with its external management company, the fund had 742 MW in operation or construction and a unit price of about $10. At the end of 2010, as we converted to a fully inte- grated power corporation, we had $1 billion in projects under construction and another $1 billion under contract, and our unit price was close to $16. Our price in part reflects growth that will double
The merger was a significant milestone for Northland. It created a business with both the operating discipline needed to deliver consistent performance and reliable shareholder returns and the strategic perspective and development expertise needed to sustain growth. Northland Power has led the way. In merging the management company and income fund, we showed the way for other power trusts that benefited from Northland’s heavy lifting in modelling their own transitions. This is a familiar role for us. We were one of Canada’s first independent power producers (IPPs) and the first to obtain public finan cing for a Canadian power project. More recently, Northland has been at the forefront of IPP wind and solar development, and
We keep finding new and creative energy solutions, even in thermal technology, where we began. Our Thorold cogeneration facility combines high energy efficiency with rapid response
to the need for new power facilities in a number of jurisdictions. For all we’ve accomplished, credit goes to the men and women
persistence in merging our two entities, finding and developing new opportunities, winning power purchase agreements (PPAs), bringing new facilities on stream and raising more than $1 billion in tough financial markets. Governance is keeping pace. Our Board has also evolved with Northland’s needs. Linda Bertoldi, Dr. Marie Bountrogianni and Peter Harder joined the Board in 2010, replacing retiring members Warren Moysey and David Rounthwaite. As part of their responsibilities, all Board members participate in regular information sessions about Northland and its business. To provide succession potential, former WestJet CEO Sean Durfy is attending Board meetings and information sessions as an observer. Northland’s horizon holds more growth. With the completion of
3
under construction and proposed Ontario facilities showcase Northland’s expertise in the full range of thermal technologies. These, plus new solar and wind capacity both under and ready for construction and exciting opportunities in pumped storage, hydro kinetics and run-of-river hydro, will provide years of profitable growth. Steady returns plus wider investor appeal. Northland has delivered average annual investor returns of 12.5% since inception – a 13-year record few can match. Going forward as a dividend- paying corporation, our combination of reliable returns and bright prospects will attract new investors in Canada and abroad. We look forward to a bright future together as Northland fulfills its promise of intelligent energy for a greener planet. James C. Temerty Chairman
Growing capacity and value 742 MW 1,264 MW April 2009 December 2010 Generating capacity Unit price $10 $16
Recent growth: Since Northland’s merger announcement in April 2009, generating capacity has grown nearly 70% and unit price by 60% to the end of 2010.
4
Perspectives 2011 ›
Strong returns: At 424%, Northland’s total return since inception doubled that of the TSX. The compounded annual return was 12.5%.
2009–10
97 00 98 99 01 02 04 03 06 05 07 09 08 10 TSX Total Return Index Northland Power Return on NPI vs. TSX Total Return Index Per cent 500% 400% 300% 200% 100% 0%
Northland Power is run by three leaders who have worked closely together for more than a decade. Each has a significant equity stake in the company, ensuring that their interests are aligned with Northland investors’ interests.
John W. Brace Salvatore Mantenuto Anthony F. Anderson
6
Perspectives 2011 ›
Director since 2010, Compensation Committee Chair, member of Audit Committee Linda L. Bertoldi Director since 2010, member of Governance Committee The Right Honourable John N. Turner, Q.C. Director since 1997, Governance Committee Chair, member of Audit Committee James C. Temerty, C.M. Chairman and Director since 1997, member of Compensation Committee Pierre Gloutney Director since 1997, Audit Committee Chair, member of Governance Committee
Director since 2010, member of Compensation Committee Sean Durfy Board observer since 2010 James C. Temerty, John N. Turner, Q.C. James C. Temerty, James C. Temerty,
7
Our Board of Directors
James C. Temerty, C.M.
Founder, Northland Power; honoured as Ernst & Young’s Canadian Entrepreneur of the Year in 2010 “Since our IPO in 1997, Northland Power has delivered average annual investor returns of 12.5%. Tiat’s a 13-year record few can match.”
Linda L. Bertoldi
Chair of the National Electricity Group at Borden Ladner Gervais; director of the Association of Power Producers of Ontario “I’ve been involved with Northland in its various forms since
innovation, integrity and management quality. Northland's also been a solid investment since the beginning.”
Former president and executive director of the Royal Ontario Museum governors; Ontario Member of Provincial Parliament 1999 through 2007 “I’ve been very impressed with the people I’ve met at
to be intelligent, ethical and committed to achieving the highest performance standards.” Sean Durfy Former president and CEO of WestJet; previously president of ENMAX Energy Corporation “Despite having an energy background, I didn’t know Northland until Jim approached me. So I did some research within my investment community network. I heard only good things – later confjrmed by my experience.” Pierre R. Gloutney Former chair of the Derivatives Committee of the Investment Dealers Association; former governor of the Canadian Derivatives Clearing Corporation “Northland has always been a fjnancially prudent company. It does a remarkably good job of mitigating risks in both project fjnancing and operations to ensure it continues to deliver reliable dividends.”
Former federal deputy minister at Industry Canada and at Foreign Affairs and International Trade; president of the Canada China Business Council “What attracts me to Northland is its commitment to the clean and green technologies we need to reduce our car- bon footprint. In that sense, Northland’s business model is highly innovative.” Tie Right Honourable John N. Turner, Q.C. Former minister of finance and prime minister of Canada; member of the House of Commons for almost 25 years “I’ve been most impressed by Northland’s leadership in my 15 years as trustee and director. Jim Temerty is a committed Canadian, and he’s recruited a strong board and management.”
8
Perspectives 2011 › JOHN W. BRACE
Strong growth plus continued stability
Over the past couple of years, as companies across the globe struggled through an economic downturn, we continued to add to our generating capacity, win new power purchase agreements and grow shareholder value. Our new Jardin d’Éole and Thorold facilities boosted Northland’s 2010 net year- end generating capacity to 819 MW. At $87 million, net income was up 35% over
in 2009 we have announced 586 MW in new power contracts in Ontario, Saskatchewan and Quebec. In themselves, these results are impressive. But our share- holders can also be confi dent that our growth is not sacrifi cing Northland’s stability. From the very beginning, we decided to build a business that would be good for our investors, customers, communities, partners and employees – not just in the short term, but for decades to
and a sustainable future is our most important responsibility. It guides decisions and actions throughout our business. Northland’s unbroken record of unitholder distributions since 1997 demonstrates the success of this formula. Going forward as Northland Power Inc., we remain committed to the current level
Long-term sales agreements with investment-grade customers have been central to our strategy of assuring dependable revenues. When signed, contracts for our operating facilities had terms
projects under construction and in advanced development have
PPAs ranging from 20 to 40 years. So, as our generating capacity
doubles in the coming years, the average PPA term will continue to be 14 years or greater. These long-term PPAs make Northland’s revenue stream highly stable and predictable.
Near-term profi ts: Projects under construction will double EBITDA by 2014.
EBITDA growth In millions
2014 2010 2009 2008 2007 2006 Estimated $0 $50 $100 $150 $200 $250 $300
9
Operating reliability and effi ciency enable us to generate equally stable and predictable cash fl
ll our sales contracts. In 2010 our thermal facilities were available 97% of the time; our wind farms’ combined availability was 98%. We achieve consistency in part through a combination of contracts and actions that stabilize and reduce major costs. Equally important are the efforts of our facilities’ operating personnel and the head offi ce staff who support them. Northland’s largest single expense is natural gas for its ther- mal facilities. All of our PPAs ensure that the cost of natural gas is fully covered by our electricity sales, locking in operating margins. Major operating equipment risks are managed under compre- hensive OEM maintenance agreements that guarantee high levels
selves stabilize cash fl
xed monthly expenses for uncertain capital expenditures. New construction stays on schedule and on budget. Successful facilities begin with meeting construction budgets and completion
ects and incident-free start-ups. In 2010, we broke ground on three major new facilities with combined capital costs of more than $1 billion. Two are in Saskatche wan, new operating territory for Northland. Spy Hill is an 86 MW natural-gas-fi red peaking project about 225 kilometres east of Regina. The North Battleford Energy Centre is a 260 MW natural-gas-fi red baseload plant about 140 kilometres northwest
the Gaspésie region of Quebec. All three of these projects are on budget and well within
2011, North Battleford in mid-2013. All three will sell energy under long-term PPAs. In addition, we have another $1 billion in projects under contract that we expect to complete over the next fi ve years.
10
Motivated, capable Northlanders are the key to making our stra tegies and plans unfold. Our leadership team has been together almost since the company began, as have many senior executives, managers and staff. Together they have the experience, judgment, leadership and operating skills to deliver results. On the front lines, our facilities teams show remarkable dedi- cation to continuous improvement while working safely and main- taining Northland’s excellent environmental record. Supporting the facilities are teams of analysts and accountants who analyze monthly operating data and work with plant personnel to identify and implement performance improvement opportunities. Our recent and projected growth is creating new career
level and made internal moves to recognize performance and position us for the future. We have also evolved a new structure to optimize management of concurrent construction projects.
David Dougall Steve Collings Jim Mulvale Bill Bilsborough
Operations vice president and 20-year Northlander David Dougall is responsible for the operational and financial performance of all generating facilities. Also pictured: Jim Mulvale, manager of environmental health and safety; Steve Collings, Kingston plant manager; and Bill Bilsborough, Thorold plant manager. Plant operating performance benefits greatly from the work
improvement opportunities.
2013 14 years 2010 14 years Secure revenue stream 1,600 MW 1,200 MW 800 MW 400 MW 0 MW
Revenue security: As Northland’s capacity grows to 1,450 MW in 2013, its average PPA term to maturity will remain constant at 14 years even if no new power agreements are signed.
11
To build leadership depth, Michael Shadbolt has come on board as general counsel, and Paul Bradley joined Northland April 1 as our new CFO. Despite Paul’s arrival, outgoing CFO Tony Anderson will remain a full member of our leadership team as chief investment
Northland in 1989 and has been a big part of our success ever since. Close third-party relationships leverage Northland’s effectiveness in every aspect of our business. We enjoy strong ties with world- class equipment, construction and financing partners, governments and their agencies, First Nations and communities. Relations with Northland host communities are especially
and create opportunities for local companies. As an example, our Kirkland Lake facility contributes about $6.5 million annually to the local economy. When invited, we readily support community initiatives and activities. When we can, we do a little extra. For example, steam from
a significant expense for the town. Stability is a core Northland value. Stability – in how we perform and how we plan for our future – is important to us. It’s a key part of what makes Northland a good company to work for, to invest in and to rely on. John W. Brace President and CEO
EBITDA by facility In millions
2010 2009 2008 2007 2006 Corporate – general Mont Miller Corporate – development Kingston Iroquois Falls Panda-Brandywine Germany Jardin d’Éole Thorold
$0 $50 $100 $150 $200
Revenue diversification: EBITDA derives from several geographic areas and regulatory regimes and will continue to diversify.
12
Leadership and expertise: The 265 MW Thorold Generating Station is Northland’s most
complex facility – and its contract obligations are equally demanding.
Thorold uses combined-cycle cogeneration to deliver electricity to Ontario’s grid, plus 24/7 process steam to an adjacent Abitibi- Bowater recycled newsprint plant. Cogeneration produces more energy per unit of fuel consumed than other natural gas techno-
given energy output. How it works: Thorold receives a dispatch signal from the Ontario electricity system operator whenever its cost-driven price per megawatt is competitive in the electricity market. Its contract with the Ontario Power Authority (OPA) provides for a capacity payment that is automatically reduced by the amount Thorold is assumed to earn during dispatch periods.
1 Natural gas fires a General Electric gas turbine to produce
up to 177 MW of electricity. The turbine is enclosed to contain noise.
2 Turbine exhaust gases at about 600°C pass into a heat
recovery steam generator (2A) that drives a steam turbine (2B), producing as much as 95 MW of additional electricity.
3 Medium-pressure steam (up to 158 tonnes per hour at 2,900
kilopascals) goes to the AbitibiBowater plant, where a back- pressure steam turbine reduces it to working pressures. The pressure reduction produces more electricity, up to 10 MW.
4 Electricity generated by the turbines flows to Ontario’s grid
and to the AbitibiBowater plant. Thanks to Thorold’s steam and electricity, the AbitibiBowater plant is much more competitive than before.
5 Welland Canal water is used for process makeup and to cool
spent steam. Waste-water treatment and cooling systems ensure that return water meets Ministry of Environment purity and temperature requirements.
6 Thorold’s stacks emit just nine parts per million of nitrous
7 Thorold is dispatched about 10 hours a day. Two auxiliary
boilers, fired by landfill and natural gas, produce process steam for AbitibiBowater during all non-dispatch periods. The Thorold Generating Station supports Ontario’s grid, enabling greater use of intermittent renewable energy such as wind and solar. It’s a powerful example of Northland’s ability to deliver intelligent energy for a greener planet.
13 1 5 5 6 7 3 4 4 AbitibiBowater 2A 2B Legend
Landfi ll gas
Condensed water
13
14
Perspectives 2011 › SALVATORE MANTENUTO
Thriving in changing markets
Just two or three decades ago, government utilities managed almost all electricity generation and distribution and developed all new power resources in Canada. Land could be expropriated for new generation projects, and environmental permitting was often fast-tracked. Nonetheless, project delays and cost
Today the landscape is very
power producers – of which Northland was among the first in Canada – now develop, build, own and operate much of the new power generation across North America. IPPs assemble land, compete to win long-term PPAs, negotiate energy sales agreements, conduct impact assessments and involve multiple stakeholders in a public process before each new project gets approval to proceed. Today, Northland understands the cost and performance profiles for a full range of clean and green technologies, anticipates chang- ing customer and stakeholder demands and knows how to thrive in evolving contracting environments. Northland’s development strategy focuses our efforts on oppor
ni ties that meet three criteria:
policies would increasingly favour clean and renewable energy
and technical expertise in our sector, plus early positioning for specific opportunities.
contracts are available with government entities or other credit- worthy counterparties. This focus protects our ability to sustain shareholder dividends at their current level or better.
ramps,” ensuring we continually reassess each project’s antici- pated returns and chance of success in securing a PPA. This discipline has enabled us to develop expertise in multiple energy technologies, squeeze maximum results from Northland’s development dollars and pursue only projects that will grow shareholder value. Early-mover advantage is crucial, so Northland developers work years ahead of official policy and contract opportunities. Competition is fierce for available sites that are priced right, are close to demand, have good grid access and are approvable for power generation. These and other factors affect a project’s capital cost and the costs of connecting and delivering its power. Together they determine whether a project is doable. Today’s competitive market rewards a delicate balance of speed and patience. We identified the potential of our Thorold facility twelve years prior to its construction and completion in April 2010. The McLean’s Mountain wind farm, which Northland is developing in partnership with First Nations, has been in development since
15
Northland tracks North American energy requirements by jurisdiction, as well as shifts in attitudes toward IPPs, changes in energy policy, new requests for proposals and special incentives and offers, such as Ontario’s Feed-In Tariff (FIT) Program for renew- able energy. Every day, Northland development teams are scouting new
sometimes for several years. Northland has chosen to build expertise across a broad range
pursuing opportunities. In addition to high-efficiency gas genera- tion, we’ve developed wind and solar installations and have low- impact hydro projects, including run-of-river and hydrokinetics, in development. Northland is fortunate to have in-house engineering capability to support development, construction and operations. Since 1987
confidence in our operating projections and provides corporate memory to benefit future decision-making. The permit process demands its own expertise. Some power developers view the public consultation process needed for new facilities as a necessary evil. We don’t. Because we aim to own the facilities we develop, Northland works with host communities and
We enter each permitting process willing to listen, working with input from our future neighbours to strengthen a project’s long-term success. Development relies on trust. Third parties, such as constructors, invest heavily when preparing large project bids in partnership with Northland. Our reputation for expertise, transparency and fair dealing has attracted world-class builders, OEMs and financial institutions as project partners.
16
Companies and communities also become partners. A manu- facturer who needs 24/7 process steam thinks carefully before out- sourcing this supply. AbitibiBowater has made the decision twice; it started taking steam from our Iroquois Falls plant in 1996 and is now the steam host at Thorold. Our 15-year record as a depend- able steam provider has also attracted two Toronto-area companies to partner with us in developing two combined heat and power projects in our pipeline. In rooftop solar, Loblaws and others have chosen Northland as their partner. Some PPA offers require the participation of communities or First Nations. In the past year, Northland has partnered on wind projects with the town of Frampton, Quebec, and the United Chiefs and Councils of Mnidoo Mnising First Nations in Ontario. Constance Lake First Nation is Northland’s partner on four run-
are ensuring that First Nations members have meaningful
Battleford Energy Centre. PPAs eliminate market risk but not contracting complexity. As power authorities use thermal generation to supplement renew- ables and to respond to seasonal and daily demand fluctuations, thermal energy PPA requirements have become more demanding. In this environment, Northland’s 20 years of contracting experi- ence are increasingly valuable. Northland’s development capabilities are evident in our robust portfolio of projects under construction, under contract and in earlier stages of development. In the past two years, we’ve added new capacity and expanded our development portfolio to over 2,500 MW. By 2014, we expect our net generating capacity will grow to more than 1,450 MW. Salvatore (Sam) Mantenuto Chief Operating Officer and Chief Development Officer
Senior Northland developers include Tim Richardson, Boris Balan, John Wright, Scott Stevens and David Cheung Atkinson. Developers aggressively seek out
cultivate their most promising prospects for years before securing a power contract.
John Wright Scott Stevens Boris Balan Tim Richardson David Cheung Atkinson
17
Intelligent energy in action
Northland’s proposed Marmora pumped-storage project is a perfect fi t for Ontario’s grid:
for new peaking capacity
solar output, improving system operations and lowering
fth the cost of natural gas generation
it needs no external electricity to start up
System Operator for more pumped storage in its mix
How it works Marmora time-shifts electrical energy by pumping water into an upper reservoir when demand (D, see inserts) is low (and electricity is plentiful and inexpensive) and allowing it to fl
demand is high. Its design uses the natural features of an abandoned mine, including a ready-made and water-fi lled lower reservoir and material to create an upper reservoir.
D
D
18
Perspectives 2011 ›
Our development team and process
Northland has been developing energy generation projects since 1987 and has evolved a highly disciplined process. All develop ment activities, including initial facilities design and engineering, are done in-house. Northland developers manage several proj
Together with Northland’s leadership, they constantly evaluate each project’s feasibility until the PPA is signed and construction contracts are in place.
Tom Hockin Greg Lennox Michael Lord Florence Au
1987 and has evolved a highly disciplined process. All develop ment are done in-house. Northland developers manage several proj
ment are done in-house. Northland developers manage several proj
Florence Au Florence Au
Feasibility 3 to 12 months Initial Development 3 to 24 months Site identifi cation Site acquisition/control Environmental constraints Applying for permits: environmental and social consultations Interconnection Preliminary engineering: design and technology Fuel/wind/water supply/solar insolation Agreements with critical parties: power off-taker and steam host Project rationale Project economics and fi nancing plan
› › › › › › › › › ›
19
Vice president of engineering Dino Gliosca and Greg Lennox, general manager, construction, are shown with members of Northland’s solar development team, led by Mike Lord. Dino and his team have been closely involved in every Northland Power project since 1987, providing design, costing and technical input to underpin development decisions and contracting and engineering management services for projects under construc-
groups supporting Northland’s development activities.
Laura Schreiner Rich Hanson Luke Kupczyk Dino Gliosca Monica Zhang Dino Gliosca Luke Kupczyk
Advanced Development 6 to 24 months Construction 12 to 48 months Site lease(s) or purchase Wind: 12 to 24 months Gas-fi red: 18 to 32 months Hydro: 24 to 48 months Solar: up to 12 months Permits completed: environmental and social Detailed engineering Contracting equipment/balance of plant: fuel supply and operations Financing (equity and debt): deposits and long-lead-time orders
› › › › › › › › › ›
20
Perspectives 2011 ›
2,500 MW pipeline to the future
Since its launch in 1987, Northland has been constantly on the hunt for opportunities to develop profitable clean and renewable energy projects that will attract long-term power purchase agreements from creditworthy off-takers. Successful development takes a unique mix of strategy, agility and patience. With a primary focus on Canada and a growing presence in the United States, Northland pursues a disciplined development process with the goal of owning and operating high-quality assets with long-term PPAs.
Early development Advanced development In construction Operation
This diagram shows Northland’s commitment to a full range of clean and green energy technologies, including projects under construction, under contract and in development in thermal, wind, solar and hydro. Northland makes a serious commitment to project
› › › › ›
Wind Solar Thermal Hydro
21
At the frontier of hydro technology
TREK is a new turbine system that captures energy directly from river fl
250 KW unit is mounted on supports that rest on the riverbed. A grid-connected prototype unit has been producing energy in the St. Lawrence River near Montreal since July 2010. Northland has exclusive rights to develop TREK sites over 8 MW across North
and is exploring others in Canada and the U.S. Since no dam or other structure is required and TREK units produce no measurable environmental impact, Northland expects the engineering and environmental approval process for TREK installations will be relatively fast and simple.
22
Perspectives 2011 ›
Northland builds for the long term
Northland Power is one of the few North American power developers that owns and operates the facilities it builds for the long term. Because developing with a long view guides Northland’s approach at every step, the company:
design and operational experience to develop projects that will per- form reliably
project’s front end to increase economic life, minimize future maintenance costs, optimize operating efficiency and lessen disruptions for our neighbours
with gas suppliers to ensure reliable and economic supply
strong, capable partners, such as Kiewit Power Constructors and General Electric, two of Northland’s supplier-partners on the North Battleford Energy Centre (opposite)
that eliminate responsibility gaps and avoid disputes among contractors/suppliers
to transfer long-term operating risks
rates to finance new projects and repaying the debt over the life of the initial PPA
Nations in new project construction and hiring permanent staff locally wherever possible
The 20-year results
Northland’s combination of a long view, close attention to design and contracting, and aggressive risk mitigation has produced an enviable track record:
and trouble-free start-ups
Electric have participated in multiple Northland projects)
steam off-takers
projects with strong partners Northland Power puts a little extra planning, expertise and capital into each project it builds. That difference helps it generate intel- ligent energy for a greener planet.
Northland has $600 million of ground-mounted solar projects getting set for construction and agreements with large retail chains to partner on rooftop solar projects.
Northland’s North Battleford Energy Centre Location: North Battleford, Saskatchewan Capacity: 260 MW Project cost: $700 million Commercial operations date: Q2 2013 Agreement: PPA with SaskPower to 2033 Northland roles: Developer, owner
23
24
Perspectives 2011 › ANTHONY F. ANDERSON
Reliable returns for today and for the future
Our chairman notes two major Northland events in the past two
challenged us to find an acceptable formula for valuing Northland’s development portfolio. Then last year, we converted the merged company from an income trust to a corporation, a move we completed on January 1, 2011, just as the old income trust tax rules expired. All this was achieved while financing significant growth in 2010 and successfully maintaining investor
position today. As our chairman also notes, investors enthusiastically endorsed
current success at winning new projects had lifted our pre-merger unit price by 60%. Northland Power is now a share corporation. As a result
investors in the United States and Europe. Over time, being a dividend-paying corporation, plus growing awareness of Northland as a generator of reliable returns, should expand the market for
Meanwhile, taxable Northland investors receiving a $1.08 annual dividend will find themselves better off in 2011 because dividends receive a more favourable tax treatment than the pre-corporatization distributions. Over the past two years, we raised nearly $760 million to finance construction at North Battleford, Spy Hill and Mont Louis. We also issued $161 million in convertible debentures and trust units and $150 million in preferred shares. Both these public
We continued to follow our strategy of using non-recourse construction financing to minimize risk for Northland investors. The $542 million North Battleford non-recourse loan was one of the largest such power project financings in North America last
at low cost is evidence of Northland’s high project quality and reputation as a solid credit risk. To create predictability in our debt servicing costs, we routinely lock in interest rates for the full term of the loans. As a by-product of fundraising in 2010, Northland now enjoys even stronger banking relationships both in Canada and interna-
Growing market cap: Northland’s market capitalization is 70% higher than in 2006, up 47% in 2010 alone.
Market cap In billions 2010 2009 2008 2007 2006 $0.0 $0.5 $1.0 $1.5 $2.0
25
fundraise for another round of new projects already under contract. These include $600 million in ground-mounted solar projects currently seeking permits. We also seized an opportunity to raise cash in an unusual way for us. In December 2010, we sold our 54 MW Mont Miller wind farm to NextEra Energy, which owns a nearly identical property next door. Consolidation of the two wind farms made operational and maintenance sense, and we determined that selling was in our best interests. We are not planning any other power asset sales – in fact, we are actively developing new projects in Quebec and other jurisdictions as described throughout this report. We’re realistic about asset amortization. In our development economics and debt management, we amortize each asset’s capital cost and permanent financing over its initial PPA. The loan that underpins Thorold, for example, will be fully paid off when the plant’s
PPA expires in 2030. The same is true for Jardin d’Éole.
We do this for two reasons. First, it’s common sense and pru- dent to avoid a large balloon debt payment and under-depreciated assets at the end of a PPA no matter how optimistic one might be about a facility’s ability to generate future income. Secondly, our policy provides future flexibility. The PPA for our Kingston facility will mature in 2017. But at that point, the plant will be fully depreciated and debt-free. As we open negotiations on how Kingston will support Ontario’s grid post-2017, having no debt and a zero cost basis strengthens our ability to make investments to attract a new PPA. Cash from operations rose 35% to $87 million in 2010. Northland’s consistent strong results are a testament to our long- term PPAs, high-quality, well-maintained plants and equipment and the dedication and expertise of our facilities’ personnel and the head office staff supporting them.
26
Part of Northland’s support structure is our energy services group, which manages electricity sales and gas supply. The group negotiates forward gas purchase contracts to align future costs with expected PPA revenues. But it also minimizes net gas and transportation costs through ongoing spot and forward purchases and sales, all within the constraints of our contractual commit-
given that gas costs can run close to 40% of a thermal plant’s sales. Strong and predictable cash flows from operations are essential to our ability to grow while sustaining investor payouts. Northland is fortunate to have seasoned people and strong systems to monitor and support our performance. Northland’s dividend pledge of $1.08 per share is rock-solid. Part of Northland’s attraction for investors has been a history of reliable cash distributions. That will not change. We have both the will and the ability to pay $1.08 per share annually going forward, despite the cash demands of new project financings.
Members of the financial performance team greet Northland’s new general counsel, Michael Shadbolt. From left: executive director, financing, Greg Keaney, vice president, energy services, Jim Cipolla, Michael Shadbolt and controller David Carruthers.
Michael Shadbolt Jim Cipolla Greg Keaney David Carruthers
Distributions and distributable cash In dollars per unit/share 2011 2010 2009 2008 2007 2006 $0.00 $0.25 $0.50 $0.75 $1.00 $1.25 $1.50 Distributions paid/dividends committed Distributable cash
Payout commitment: Northland is committed to maintaining its annual dividend
27
Paying out $1.08 per share during these high-growth years has increased our ratio of payouts to free cash to greater than 100%. We expect that the ratio will remain above 100% until 2013, when North Battleford begins to generate revenue. An upside of growth is the tax pools it provides. Capital cost allowances for effi- cient generating facilities are generally eligible for acceler- ated depreciation rates. The large tax pools from Thorold and Jardin d’Éole,in addition to pools that will be avail- able once the projects under construction and in advanced development come online, mean that Northland will pay minimal income tax for a number of
Our aim is to generate intelligent energy for a greener planet. Like the power facilities we operate, our financial planning and poli- cies are designed for the long term. We see no conflict between high performance and a sustainable future. In fact, we believe the two go hand in hand. Investors, employees, partners and others who count on Northland now and for their futures can have confidence in our consistent high performance going forward. After all, Northlanders have been thinking and working this way since we began. Anthony F. Anderson Chief Financial Officer
Capital structure Preferred shares Equity at market value Convertible debentures Non-recourse project debt 63% 29% 6% 3%
Tax planning: Accelerated writeoffs of large tax pools will reduce Northland’s income taxes to minimal levels for several years.
Tax pools In billions 2013 2012 2011 2010 2009 Ontario FIT projects Projects under construction Merger $0.0 $0.5 $1.0 $1.5 $2.0 $2.5 Payout ratio Per cent 2010 2009 2008 2007 2006 0% 25% 50% 75% 100% 125%
Dividend management: Northland’s planned payout ratio will remain above 100% through 2013. In 2014, revenues from North Battleford and other projects under construction will grow free cashflow to more than cover dividend payments. Long-term, Northland expects operating revenues to fully fund current or higher dividend levels.
28
Perspectives 2011 ›
Net generating capacity in operation and under contract In megawatts Frampton 2015 Kabinakagami 2014 North Battleford 2013 McLean’s Mountain 2012 Ontario solar 2012 Mont Louis 2011 Spy Hill 2011 Thorold 2010 Jardin d’Éole 2009 Germany 2006 Kingston 2006 Kingston 2004 Kirkland Lake peaker 2004 Panda-Brandywine 2003 Kingston 2002 Iroquois Falls 1996 Kirkland Lake 1991 Cochrane 1990 Wind Thermal Hydr0 Solar Note: Years denote commercial
50 100 150 200 250 300
Growing powerhouse: Northland’s portfolio of clean and renewable power projects is diversified by both technology and geography. All generation is contracted under long-term PPAs with creditworthy off-takers. And the future promises more growth, with 1,800 MW of active development projects not shown on this graph and Northland teams working across North America to turn up new opportunities for intelligent energy.
30
Perspectives 2011 ›
90 95 94 96 91 92 93 97 98 99 00 03 02 01 08 07 06 05 04 09 10 13 12 11 15 14 Cumulative growth in Northland Power generating capacity In megawatts
Northland’s Mont Louis Wind Farm Project Location: Gaspésie region of Quebec Capacity: 100 MW Project cost: $180 million Commercial operations date: Q3 2011 Agreement: PPA with Hydro-Québec to 2031 Northland roles: Developer, owner
30 St. Clair Avenue West 17th Floor Toronto, Ontario, Canada M4V 3A1
northlandpower.ca
Design: Klaus Uhlig Communications Inc. – www.uhlig.ca • Printed in Canada