
SLIDE 1
Covid-19 Explanatory Model: A Decomposition V2 20 July 2020 2020-Schield-Covid19-Explain-Slides-0719.pdf 1
Schield: 2020 Covid19 Explain Slides 0719V2 1
by Milo Schield ASA Fellow Consultant: University of New Mexico President: National Numeracy Network July 19, 2020
www.StatLit.org/pdf/ 2020-Schield-Covid19-Explain-Slides-0719.pdf
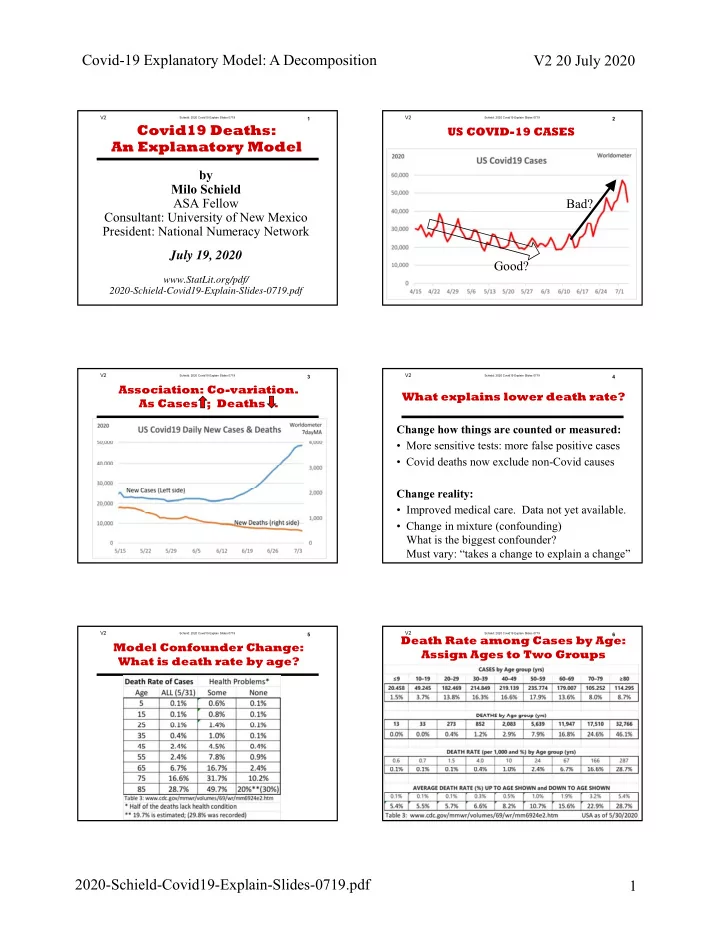
Covid19 Deaths: An Explanatory Model
Schield: 2020 Covid19 Explain Slides 0719V2
.
2
US COVID-19 CASES
Bad? Good?
Schield: 2020 Covid19 Explain Slides 0719V2
.
3
Association: Co-variation. As Cases ; Deaths .
Schield: 2020 Covid19 Explain Slides 0719V2
Change how things are counted or measured:
- More sensitive tests: more false positive cases
- Covid deaths now exclude non-Covid causes
Change reality:
- Improved medical care. Data not yet available.
- Change in mixture (confounding)
What is the biggest confounder? Must vary: “takes a change to explain a change”
4
What explains lower death rate?
Schield: 2020 Covid19 Explain Slides 0719V2
.
5
Model Confounder Change: What is death rate by age?
Schield: 2020 Covid19 Explain Slides 0719V2
.
6
Death Rate among Cases by Age: Assign Ages to Two Groups