
SLIDE 1
1
1
Corporate Presentation 1 1 Energean at a Glance The leading - - PowerPoint PPT Presentation
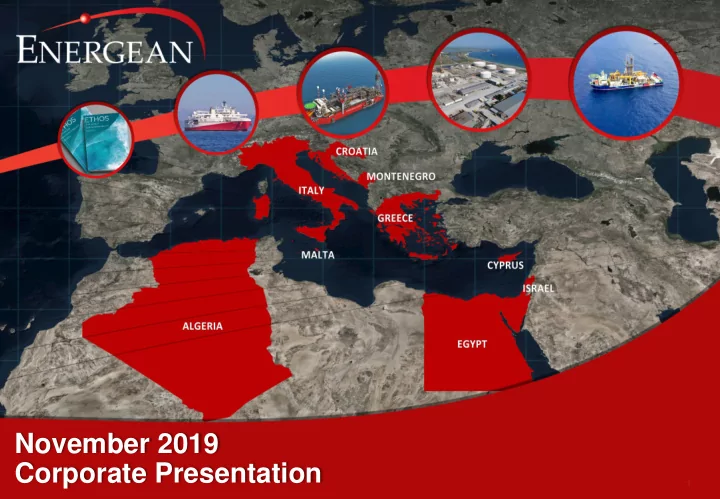
November 2019 Corporate Presentation 1 1 Energean at a Glance The leading sustainable, gas-focused, independent E&P company in the Mediterranean 9 ESG & HSE 609 mmboe 70 kboed 80% FTSE 250 & Countries of focused 2P Reserves
1
1
2
2
9
Countries of Operations
609 mmboe
2P Reserves
70 kboed
production
80%
gas-weighted
ESG & HSE
focused A rating MSCI
FTSE 250 & TA-35 Med Focused
The leading sustainable, gas-focused, independent E&P company in the Mediterranean
3 100 200 300 400 500 600 700
2008 2009 2010 2011 2012 2013 2014 2015 2016 2017 2018 2019
mmboe
Prinos 2P Prinos 2C Katakolo 2P Karish and Tanin 2P Karish and Tanin 2C Edison
3
Acquisition
Third Point invests in Energean Analysts predict $200 oil price Analysts predict $20 oil price Energean acquires Karish & Tanin Energean IPO & Project FID Edison E&P acquisition Development
2 609
Reserves stated as net working interest, exclusive of Kerogen minority
4
4
482 127
Gas Liquids
609
Production Reserves
79% gas-weighted 2007 2018 2019 2022 1 4 70 140
185 kboe/d with FPSO at full capacity
Growing production from mature assets Edison Acquisition Fast track development of Karish
kboe/d
Israel 49% (297 mmboe) Egypt 25% (152 mmboe) Italy 14% (85 mmboe) Greece 8% (50 mmboe) Croatia <1% Algeria 4% (24 mmboe)
5
$265 million equity raise on LSE and TASE $200 million RBL for Prinos & Epsilon $1.275 billion Project Finance facility for Karish
5
$600 million committed Bridge Loan Facility $460 million equity raise through LSE IPO $750 million Acquisition 2019 2018 $250 million Third Point investment 2013-2015 $280 million Sale of North Sea asset to Neptune
6
6
beaches next to our oil & gas production platforms
FPSO Hull construction.
7
8
Key Facts & Figures
RESOURCES OWNERSHIP DEVELOPMENT CONCEPT SERVICE PROVIDERS REVENUES CAPEX STRATEGY
2.4 Tcf + 32.8 mmbbls (gross) 2P (92%) + 2C (8%) 0.9 Tcf + 34.2 mmbls (gross) Karish North discovery 6.3 Tcf + 83 mmbbls gross prospective resources Energean Israel is owned 70% Energean plc, 30% Kerogen1 FID March 2018, First Gas 2021 8 BCM/yr owned FPSO with subsea tie-backs 800,000 bbls oil & condensate storage capacity Gas pipeline to shore. Liquids tanker offload TechnipFMC: lump-sum EPCIC Stena: 5 firm + 5 optional wells Wood contracted for ops and maintenance. 4.5 Bcm/yr firm GSPAs plus 0.4 Bcm/yr IPM contract plus 0.7 Bcm/yr Or contract $1.6bn to 2021 Funded by $1.3bn Project Finance + $440m net IPO proceeds Secure additional resource and offtake to fill the FPSO
KEY DATES
8
9
FPSO Workstream
Hull First Steel Cut 4Q Topsides First Steel Cut 4Q Hull Keel Laying 2Q Hull and Topsides Construction 1Q – 4Q Hull Sailaway from Cosco Yard 4Q Hull and Topsides Integration 1Q – 4Q FPSO mooring hookup and Riser Performance testing
2018 2019 2020 2021
Achieved November 2018 Achieved November 2018
Drilling Workstream
Mobilise Stena DrillMAX 1Q Karish North, KM-03, KM-01 & KM-02 1Q – 4Q Zeus Exploration 1Q
Rig mobilized February 2019
2019
Discovery
Subsea and Onshore Workstreams
Pipeline beach crossing at Dor 1Q – 4Q Pipeline installation Karish to Dor 3Q – 1Q20 Onshore facilities commissioning 2Q – 4Q Installation of subsea infrastructure 1Q – 4Q
2019 2020
FID (1Q 2018) First Gas On track
9 Complete Development Wells 4Q
10
10
Hull ready for undocking, COSCO Zhoushan Yard (Sept 2019) Hull towing, Zhoushan (Sept 2019) Topsides overview, Sembcorp Marine Admiralty Yard (Sept 2019) Assembly, Sembcorp Marine Admiralty Yard (Sept 2019)
11
11
636 610
MCC= Milestone Completion Certificate
12
Karish Main 02 drilling completed end June Karish Main 03 drilling completed early August Karish Main 01 drilling completed October
− Optimised well construction sequence − Delivered low spread cost <$400 K/d
12
JAN FEB MAR APR MAY JUN JUL AUG SEP OCT NOV DEC
Karish Main 1,2 & 3 TOPHOLES Karish Main 1, 2, & 3 DRILLING Karish North EXPLORATION Karish Main COMPLETION
KARISH WORK PROGRAMME 3x DEV Wells + 1x EXP Well
Karish North APPRAI SAL
13
Seismic Attribute
KARISH NORTH
13
Low Case Best Estimate High Case GIIP (Tcf) 1.1 1.3 1.8 GIIP (BCM) 30.0 35.6 51.6 Recoverable Gas (Tcf) 0.7 0.9 1.4 Recoverable Gas (BCM) 19.5 24.9 38.7 Recoverable Liquids (MMbbls) 25.2 34.2 55.0
with thinly bedded sections of the reservoir in the B Sand Unit
− Will be confirmed via acquisition of a
core when well is completed as a producer
14
14
6.3 Tcf (c.178bcm) Prospective Resources 2.4Tcf (68bcm) 2P & 2C
Total Reserves & Resources 1 – 1.5 Tcf (c.28 - 42bcm) GIIP at Karish North
15
15
Unrisked in Place Volumes (Bcf / Bcm) Geological Chance of Success (%) A Sand 467 / 13 77 B Sand 123 / 3 72 C Sand 52 / 1 68 Total 641 / 18 NA
− Between Karish & Tanin leases − Development synergies with Tanin
Energean Power FPSO
and Tanin leases)
16
Contracted volumes & spare capacity
IPM Contract MRC Contract 11 Firm Contracts Or Contract 0.4 BCM/yr contingent on additional resource in
0.5 BCM/yr term sheet. MRC is the winning bidder in the IEC Alon Tavor tender process. Both parties intend to convert to a firm GSPA 0.7 BCM/yr contingent on Or Power Plant Close. Or has unlimited capacity to dispose of gas for alternate uses
Available for tie-back of future discoveries and additional gas sales from Karish North
4.5 BCM/yr
75% ToP Major IPPs and Industrial customers
16
Secured Revenues
1 2 3 4 5 6 7 8 9 1/1/2021 1/1/2022 1/1/2023 1/1/2024 1/1/2025 Firm Contracts IPM Contract MRC Term Sheet Or Contract Spare Capacity
4.5 4.9 5.4 6.1
17
5 10 15 20 25 30 35
bcma
Energean Contracted Energean Available Capacity Rest of Market per Adiri Additional demand per BDO
Israel Gas Demand Growth Recent Updated and Progress
Site Capacity – MW Bcm/y Last date of delivery of possession Alon Tavor 600 0.5 December 2019 Ramat Hovav 1,137 1.0 December 2020 Reading 428 0.4 June 2020 Hagit 697 0.6 June 2021 Eshkol 1,693 1.8 June 2022
Power station privatisation
17
Closure of the following coal-fired power-stations announced, increasing demand for gas:
Term sheet executed with MRC Alon Tavor Power Ltd
gas to MRC for use in the natural gas fired generation units in the Alon Tavor site
which will confirm the agreement between them
19
10yr estimated unlevered IRR
Payback on Production
AV/2P
Reported Working Interest 2P Reserves Reported 2018 Working Interest Production
Sources: Company Information, CPR, Management Estimates, Capital IQ 1. As per Management Estimates 1.083 917 745 609 465 444 285 280 245 194 155 56 47 200 400 600 800 1.000 1.200
Co'y 1 Co'y 2 Co'y 3 Edison + Energean Co'y 4 Co'y 5 Co'y 6 Co'y 7 Co'y 8 Co'y 9 Co'y 10 Co'y 11 Co'y 12
156 140 82 81 81 81 70 55 51 41 34 18 7
50 100 150 200
Co'y 1 Energean + Edison (2022E) Co'y 2 Co'y 3 Co'y 4 Co'y 5 Energean + Edison Co'y 6 Co'y 7 Co'y 8 Co'y 9 Co'y 10 Co'y 11 Co'y 12
18%
10yr estimated unlevered IRR
c.3 yrs.
Payback on Production
2.6
AV/2P
Pre-Neptune Disposal Post-Neptune Disposal
20
20
Source: Company information, CPR 1. Metrics presented on a 2018 basis
347 262
W.I. 2P Reserves (mmboe)
4 66
Production (kboe/d)
90 566
Revenue ($ MM)
Growth story, focused on developing new reserves Immediate cash flows & EBITDAX with incremental growth opportunities Full-Cycle, Low Cost, Growth Oriented but with a Diverse Underlying Cash Flow Base
21
21
50 100 150 200 250 2019 2020 2021 2022 2023 2024 2025 Greece Assuming Karish & Tanin FPSO at Full Capacity Israel Egypt Italy Algeria Croatia 2019 2020 2021 2025 2022 2023 2024
We need exactly(!) the same chart just without UK and Norway 21
Sources: Company Information, CPR, Management Estimates 1. Metrics presented on a net working interest basis 2. As per Management Estimates 3. Represents committed exploration spend
Clear Trajectory to 200 kboe/d(1) (2)
Combined 2019 - 2025 Production Profile by Country (kboe/d)
Bridging near term cash flow generation Enhancing post 2021 cash flows and supporting medium- term ambition to pay a dividend
22
‒ $750 MM up-front cash ‒ $100 MM contingent on Cassiopea first gas funded via FCF ‒ 8% profit oil royalty on discoveries made by upcoming drilling drilling, funded through FCF
July 2019
Consideration and Funding Sources and Uses
Equity Placing
‒ Refinancing H2 2019 – completion expected 4Q19 ‒ Expected Net Debt : EBITDAX not to exceed 2x for more than 1 year (excl. Israel non-recourse project financing) ‒ Strong combined cash flow expected to support deleveraging thereafter
$250 million + $30 million contingent
Other Financing Up front Cash Consideration $750 MM Ongoing Funding Requirements $115 MM Total Funding Requirements $865 MM Equity Placing $265 MM Bridge Loan $600 MM Total Funding Sources $865 MM 22 Disposal of North Sea Assets $250 MM
23
Equity Raise July 19 Regulatory Approvals and Partner Consents H2 19 Reserve Based Facility Takeout of Bridge Loan H2 19 Publication of Circular and EGM Q4 19 Publication of Enlarged Group Prospectus and Technical Readmission Q4 19 Completion expected Year End 2019
23
Bridge Facility Agreement signed July 19 Planned Disposal of Non-Core Assets H2 19
Initiated & Progressing as Expected Initiated & Progressing as Expected No Change to Expectations No Change to Expectations No Change to Expectations
Transaction Signing & Announcement July 19
24
24
25
25 Continuous Growth in Reserves & Resources
Demonstrable Operational Track Record Prinos Basin Highlights
Island)
2 5 7 11 17 24 30 58 58 57 73 73 10 20 30 40 50 60 70 80 2008 2009 2010 2011 2012 2013 2014 2015 2016 2017 2018 2019 mmboe Prinos 2P Prinos 2C
26
26
prolific Ionian Basin and Apulian platform
Material Position
Prolific Geology
Ongoing Activity
27
27
30
mmbbls and 1,766.1 Bcf
Material Position Commitments Fulfilled Majors focusing on the area
−
338 km2 new 3D shot in Feb 2019
−
To be processed together with legacy 2D
−
Full results expected end-2019
−
Drill-or-drop decision 2020
−
Shot seismic in 4Q 2018-1Q 2019
−
Expected to drill two wells in 2019-2020
28
28
Sources: Company Information
North Thekah Offshore Exploration NEA Final Investment Decision North East Hap’y Exploration Abu Qir Infill Drilling NEA First Gas Epsilon First Oil Echo (W. Patraikos) Exploration Additional Israeli Wells Potential exploration drilling Karish North Appraisal Karish First Gas Karish Additional GSPAs Rospo Sidetracks Cassiopea First Gas Gemini & Centauro Prospect Drilling
FID
Country Asset Activity H2 2019E H1 2020E H2 2020E 2021E/22E
Sources: Company Information