SLIDE 1 Constraints on Heating During the Era of First Galaxies: Recent Results from PAPER
Adrian Liu, BCCP Fellow, UC Berkeley ICTP Workshop
SLIDE 2 Take-home points
- The PAPER instrument does not look like a
conventional imaging radio interferometer. Short, redundant baselines provide good sensitivity.
- PAPER’s unusual design has led to some unusual
analysis techniques, such as redundant baseline calibration and fringe-rate filtering.
- Recent PAPER measurements have set
scientifically interesting upper limits on the 21cm power spectrum, placing constraints on heating at z = 8.4
SLIDE 3
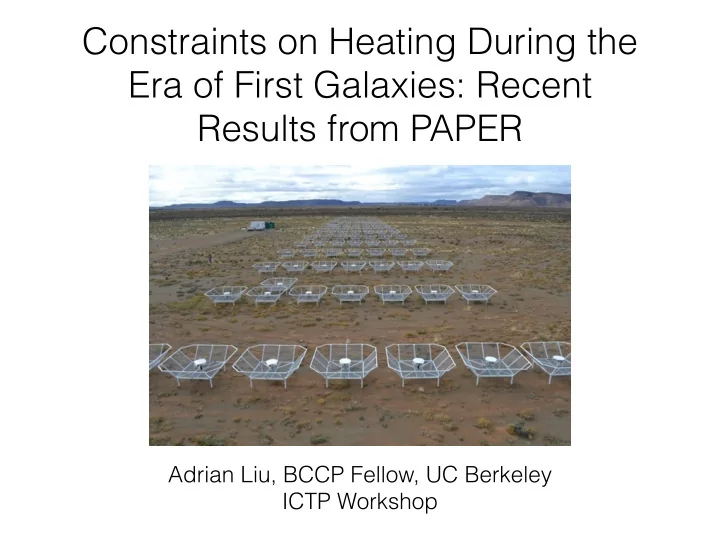
The PAPER instrument
SLIDE 4
Donald C. Backer Precision Array for Probing the Epoch of Reionization (PAPER)
SLIDE 5 PIs: Parsons, Bradley ¡ Co-PIs: Aguirre, Carilli Ali, Boyd, Chang, Cheng, DeBoer, Dexter, Dillon, Greenberg, Gugliucci, Horrell, Hsyu, Jacobs, Klima, Lacasse, AL, MacMahon, Moore, Parshare, Pober, Stefan, Walbrugh, Zheng
SLIDE 6
Why does PAPER look the way it does?
SLIDE 7
SLIDE 8
kx ky kz
F r e q u e n c y
SLIDE 9
A bright “wedge” appears. These are foreground contaminants
Pober et al. (2013)
SLIDE 10
Foregrounds are bright and dominate the cosmological signal
~100s to 1000s K
~ few mK ?
SLIDE 11
Foregrounds are expected to be smooth functions of frequency
Frequency/radial dist Frequency
Foregrounds Cosmological signal
SLIDE 12
θy kx ky
kx ky
Foregrounds and power spectra
SLIDE 13
Foregrounds here, perhaps?
Foregrounds are probably localized in Fourier space…
SLIDE 14
…but not THAT localized because of subtleties associated with interferometry
Pober et al. (2013)
SLIDE 15
An interferometer builds up a picture of the sky Fourier mode by Fourier mode
SLIDE 16
Baseliney Baselinex
θx θy
kx ky
kx ky
Interferometry and power spectra
kx ky
Image credit: Pober
SLIDE 17
~ Baseline time delay
SLIDE 18
~ Baseline time delay
Delay Time
SLIDE 19
~ Baseline time delay
SLIDE 20
Short baseline Low k Long baseline Large k
~ Baseline time delay
Delay Delay Time
SLIDE 21
Foregrounds should appear in a “wedge”
Short baselines Long baselines Long delays Short delays
SLIDE 22
Foregrounds should appear in a “wedge”
Short baselines Long baselines Long delays Short delays
AL et al. 2014a,b
SLIDE 23
The foregrounds are dimmer at high k
Pober et al. (2013)
Short baselines Long baselines
SLIDE 24
Signal-to-noise is best at low k, but that’s where foregrounds are the worst
Pober et al. (2013)
High Signal to Noise Short baselines Long baselines Low Signal to Noise
SLIDE 25
Pober et al. (2013)
Short baselines Long baselines
Signal-to-noise is best at low k, but that’s where foregrounds are the worst
SLIDE 26
Pober et al. (2013)
Short baselines Long baselines
Signal-to-noise is best at low k, but that’s where foregrounds are the worst
SLIDE 27
Short baselines provide sensitivity while evading foregrounds and allowing novel calibration and analysis techniques
SLIDE 28 Identical baselines sample exactly the same modes
(Noise temp) ~ 1/sqrt(N) P(k) ~(temp)2 ~ 1/N Raw data P(k)
SLIDE 29
Baselines see different Fourier components and cannot be combined… P(k) ~1/sqrt(N) Raw data P(k)
SLIDE 30
Some analysis tricks
SLIDE 31
Short, redundant baselines provide sensitivity, evade foregrounds, and…
SLIDE 32 …allow for sky-independent calibration
¡
¡ ¡ ¡ ¡ ¡ ¡ ¡ ¡ ¡ ¡6 ¡antennas ¡ ¡ ¡ ¡ ¡ ¡ ¡ ¡ ¡ ¡ ¡ ¡ ¡ ¡ ¡ ¡ ¡15 ¡baselines ¡ ¡ ¡ ¡ ¡ ¡ ¡ ¡ ¡ ¡ ¡ ¡ ¡ ¡ ¡ ¡7 ¡unique ¡baselines ¡ ¡
Zheng et al. (2014) AL et al. (2010) Parsons, AL et al. (2014)
SLIDE 33
Parsons, AL et al. (2015)
SLIDE 34
Parsons, AL et al. (2015)
Different fringe-rates in the data correspond to different parts of the sky
SLIDE 35
Parsons, AL et al. (2015)
A careful weighting of fringe-rates allows different parts of the sky to be isolated
SLIDE 36
Parsons, AL et al. (2015)
Foreground systematics can be further mitigated by beam-sculpting
SLIDE 37
Fringe-rate filtering = Optimal mapmaking Parsons, AL et al. (2015)
SLIDE 38
Latest upper limits from PAPER
SLIDE 39 Recent upper limits from the PAPER-64 array
- 135 days of observation.
- Results centered on z ~ 8.4 (151 MHz).
- 64 element array.
- Drift-scan configuration.
- Analysis tricks:
- Improved redundant calibration (“omnical”)
- Near-optimal quadratic estimators
- Fringe-rate filtering
SLIDE 40 PAPER 64-element array: Upper limit of (22.4 mK)2 at 2-sigma in range 0.15 < k < 0.5h Mpc-1
0.0 0.1 0.2 0.3 0.4 0.5 0.6
k [hMpc-1]
100 101 102 103 104 105
Δ2(k) [mK2]
Ali, Parsons, …, AL et al. (2015)
SLIDE 41 0.0 0.1 0.2 0.3 0.4 0.5 0.6
k [hMpc-1]
100 101 102 103 104 105
Δ2(k) [mK2]
Ali, Parsons, …, AL et al. (2015)
GMRT, Paciga et al. (2015) MWA-32 Dillon, AL et al. (2014) PAPER-32 Parsons, AL et al. (2014)
PAPER 64-element array: Upper limit of (22.4 mK)2 at 2-sigma in range 0.15 < k < 0.5h Mpc-1
SLIDE 42 0.0 0.1 0.2 0.3 0.4 0.5 0.6
k [hMpc-1]
100 101 102 103 104 105
Δ2(k) [mK2]
Ali, Parsons, …, AL et al. (2015)
PAPER 64-element array: Upper limit of (22.4 mK)2 at 2-sigma in range 0.15 < k < 0.5h Mpc-1
SLIDE 43 0.0 0.1 0.2 0.3 0.4 0.5 0.6
k [hMpc-1]
100 101 102 103 104 105
Δ2(k) [mK2]
Ali, Parsons, …, AL et al. (2015)
PAPER 64-element array: Upper limit of (22.4 mK)2 at 2-sigma in range 0.15 < k < 0.5h Mpc-1
SLIDE 44 0.0 0.1 0.2 0.3 0.4 0.5 0.6
k [hMpc-1]
100 101 102 103 104 105
Δ2(k) [mK2]
Ali, Parsons, …, AL et al. (2015)
PAPER 64-element array: Upper limit of (22.4 mK)2 at 2-sigma in range 0.15 < k < 0.5h Mpc-1
SLIDE 45
Pritchard & Loeb (2010)
SLIDE 46
Pritchard & Loeb (2010)
SLIDE 47 R e h e a t i n g Pritchard & Loeb (2010)
SLIDE 48 R e h e a t i n g Reionization Pritchard & Loeb (2010)
SLIDE 49 R e h e a t i n g Reionization C
d R e i
i z a t i
N
e a t i n g Pritchard & Loeb (2010)
SLIDE 50 Pritchard & Loeb (2010) R e h e a t i n g Reionization C
d R e i
i z a t i
N
e a t i n g
Current PAPER limits disfavor “cold reionization” with little heating
Parsons, AL et al. 2014,
ApJ 788, 106 Ali, Parsons, …, AL et al. 2015, arxiv: 1502.06016 Pober, Ali, …, AL et al. 2015, arxiv: 1503.00045
SLIDE 51
Pober et al. (2015)
SLIDE 52
Pober et al. (2015)
SLIDE 53
Brighter spin temperatures give dimmer 21cm power spectra
Pober et al. (2015)
SLIDE 54
Extreme neutral fractions give dimmer 21cm power spectra
Pober et al. (2015)
SLIDE 55
Beginning of reionization Middle of reionization End of reionization
SLIDE 56
SLIDE 57
For neutral fractions between 30% and 70%, PAPER observations imply Tspin > 10 K In contrast, Tgas = 1.18 K assuming adiabatic cooling Thus, reheating must have taken place if Tgas and Tspin are coupled at z = 8.4 Pober, Ali, …, AL et al. 2015, arxiv: 1503.00045
SLIDE 58 Take-home points
- The PAPER instrument does not look like a
conventional imaging radio interferometer. Short, redundant baselines provide good sensitivity.
- PAPER’s unusual design has led to some unusual
analysis techniques, such as redundant baseline calibration and fringe-rate filtering.
- Recent PAPER measurements have set
scientifically interesting upper limits on the 21cm power spectrum, placing constraints on heating at z = 8.4