conceptual validation tests on forced convection
play

Conceptual Validation Tests on Forced Convection Condensation using - PDF document

Transactions of the Korean Nuclear Society Virtual Spring Meeting July 9-10, 2020 Conceptual Validation Tests on Forced Convection Condensation using SISTA Taehwan Ahn , Jinhwa Yang, Youyeon Choi, Chanjong Seo, Bae Hwang, Hyun-Sik Park Korea


  1. Transactions of the Korean Nuclear Society Virtual Spring Meeting July 9-10, 2020 Conceptual Validation Tests on Forced Convection Condensation using SISTA Taehwan Ahn  , Jinhwa Yang, Youyeon Choi, Chanjong Seo, Bae Hwang, Hyun-Sik Park Korea Atomic Energy Research Institute 989-111 Daedeokdaero, Yuseong-gu, Daejeon, 34057, South Korea * Corresponding author: thahn103@kaeri.re.kr 1. Introduction The outer wall temperature was measured with a 0.5 mm sheathed TC installed in the pipe wall groove, and the fluid temperature inside the pipe was measured with One of small modular pressurized water integral-type thermocouples which traverse radially with 13 points. reactors SMART [1] selected newly developed passive The thermocouples for the ECT temperature were safety design concept–containment pressure and installed along the center line of the ECT at the same radioactivity suppression system (CPRSS) [2]. When height as the measuring position. design basis accidents (DBAs), such as small break loss- Local heat flux was calculated by condensate rate. of-coolant-accident (SBLOCA) or main steam line break   m m (MSLB), it removes steam and radioactive material  s _ i 1 s _ i (1) q " h ejected into low containment area (LCA).   fg 0.0175 L CPRSS includes a vertical condenser (CHX: CPRSS Here, the local steam flow rate was calcuated from the heat exchanger) submerged in an emergency cooldown local air mass fraction. tank (ECT) as an ultimate heat sink. The heat exchanger       m m 1 w / w  (2)  is operated by forced convection condensation in s a a a presence of non-condensable gas under initial transient Local air mass fraction was calculated by measured temperature and pressure with an ideal gas assumption. condition. Therefore, it is important to understand the condensation in a submerged vertical pipe under air- P   w 1 1.61 s (3) steam mixture conditions. a  P 0.61 P t s In this study, a separate effect test was performed to Local steam quality was calculated as follow. verify the performance of a vertical condensation pipe  x m / m (4) with an inner diameter of 17.5 mm. Air/steam mixture s s _ in Finally, heat trasnfer coefficient was obtained as temperature and heat transfer coefficients (HTC) inside the pipe were locally measured and effects of inlet steam follow.   mass flux, inlet air mass fraction and temperature   h q "/ T T (5) sat wi distribution of cooling water in ECT were investigated. The experiment was conducted under 1 bar in the test section. The inlet air mass flux (G s_in ) and inlet air mass 2. Experimental Setup fraction (w a_in ) ranged 5–10 kg/m 2 s and 0.1–0.4, respectively. 
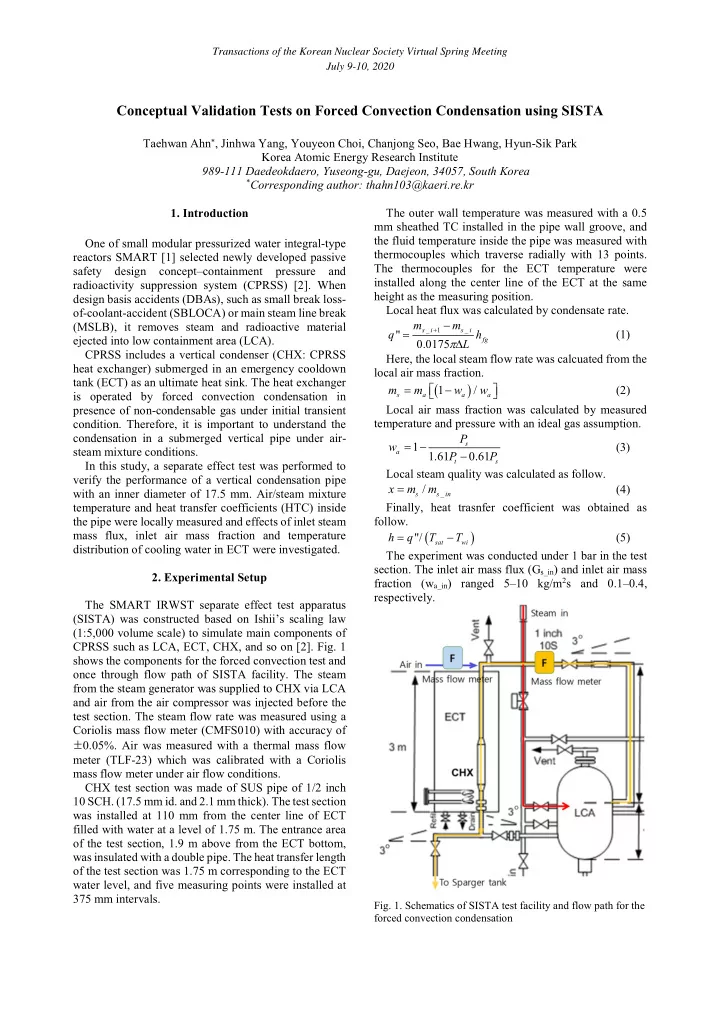
The SMART IRWST separate effect test apparatus (SISTA) was constructed based on Ishii’s scaling law (1:5,000 volume scale) to simulate main components of CPRSS such as LCA, ECT, CHX, and so on [2]. Fig. 1 shows the components for the forced convection test and once through flow path of SISTA facility. The steam from the steam generator was supplied to CHX via LCA and air from the air compressor was injected before the test section. The steam flow rate was measured using a Coriolis mass flow meter (CMFS010) with accuracy of ± 0.05%. Air was measured with a thermal mass flow meter (TLF-23) which was calibrated with a Coriolis mass flow meter under air flow conditions. CHX test section was made of SUS pipe of 1/2 inch 10 SCH. (17.5 mm id. and 2.1 mm thick). The test section was installed at 110 mm from the center line of ECT filled with water at a level of 1.75 m. The entrance area of the test section, 1.9 m above from the ECT bottom, was insulated with a double pipe. The heat transfer length of the test section was 1.75 m corresponding to the ECT water level, and five measuring points were installed at 375 mm intervals. Fig. 1. Schematics of SISTA test facility and flow path for the forced convection condensation

  2. 3. Results and Discussion 2.1 Local Temperature Fig. 2 shows the temperature distribution of the air/steam mixture inside the test section under an inlet steam mass flux of 5 kg/m 2 s and an inlet air mass fraction of 0.2. The temperature has a lower value toward the wall. This is due to the accumulation of non-condensable air near the walls. As it goes to the downstream, the saturation temperature decreases as the steam partial pressure decreases, and the non-uniform distribution near the wall surface becomes more significant. Fig. 3 shows the temperature distribution of the mixture, inner wall, and ECT along the axial direction. Fig. 2. Temperature distribution of air/steam mixture along 2.2 Heat Transfer Coefficients the radius Fig. 4 shows the distribution of heat transfer coefficients with respect to the steam quality. The heat transfer coefficient increases as the inlet steam mass flow rate increases. This is because the thermal resistance decreases as the condensate film becomes thin due to the interfacial shear force [3]. In addition, as the steam velocity increases, the turbulent mixing effect hinders the formation of an air layer formed near the wall [4]. On the other hand, when the inlet air mass fraction increases, the heat transfer coefficient decreases by preventing the steam from contacting the wall. 2.3 Effects of ECT Temperature Distribution The ECT with vertical pipe heat exchanger has a thermal stratification as time goes on. Fig. 5 shows two conditions of the ECT temperature distribution. Fig. 6 Fig. 3. Temperature distribution along the pipe axis shows the distribution of local heat flux in the axial direction. When the ECT thermal stratification is small, the heat flux decreases from the inlet to the outlet. This is because the condensate film becomes thick and the air mass fraction increases as condensation occurs along the pipe. However, when the ECT thermal stratification is significant, the temperature difference between the steam and the coolant is small at the inlet region, leading to the lower heat flux. Fig. 7 shows the local heat transfer coefficient with respect to the steam quality in different cooling conditions. The steam quality of the data is low under the low ECT temperatures. The heat transfer coefficient distributions of the two conditions are smoothly coupled, which means that the local heat transfer coefficient mainly depends on the steam quality regardless of the temperature distribution of the ECT. Fig. 4. Heat transfer coefficient with respect to the steam quality in different inlet steam mass flux and inlet air mass fraction

  3. 4. Conclusions In order to investigate the heat transfer characteristic of CHX in CPRSS, an in-tube condensation heat transfer experiment was conducted under air/steam mixture condition in a vertical pipe with an inner diameter of 17.5 mm. From the local temperature distribution of the mixture inside the pipe, it was confirmed that the air mass fraction was increased near the wall surface to inhibit condensation heat transfer. The local heat transfer coefficient decreases as the steam mass flux decreases and the air mass fraction increases. In addition, the distribution of heat flux varied greatly depending on the temperature distribution of the ECT cooling water, while the distribution of heat transfer coefficient with respect to the steam quality was not significantly affected. Fig. 5. Temperature distribution of cooling water in ECT REFERENCES [1] K. K. Kim, et al., SMART: The First Licensed Advanced Integral Reactor, Journal of Energy and Power Engineering, Vol. 8, p. 94-102, 2014. [2] J. H. Yang, et al., Conceptual Validation Test of CPRSS with SISTA, Transactions of the Korean Nuclear Society Autumn Meeting, Goyang, Korea, Oct. 24-25, 2019. [3]T. H. Ahn, J. H. Kang, B. G. Bae, J. J. Jeong, and B. J. Yun, Steam condensation in horizontal and inclined tubes under stratified flow conditions, International Journal of Heat and Mass Transfer, Vol.141, p. 71, 2019. [4] T. Wu, and K. Vierow, Local heat transfer measurements of steam/air mixtures in horizontal condenser tubes. International journal of heat and mass transfer, Vol.49 (15-16), p. 2491, 2006. Fig. 6. Heat flux distribution under different ECT temperature condition Fig. 7. Heat transfer coefficient with respect to the steam under different ECT temperature condition

Download Presentation
Download Policy: The content available on the website is offered to you 'AS IS' for your personal information and use only. It cannot be commercialized, licensed, or distributed on other websites without prior consent from the author. To download a presentation, simply click this link. If you encounter any difficulties during the download process, it's possible that the publisher has removed the file from their server.

Recommend


More recommend