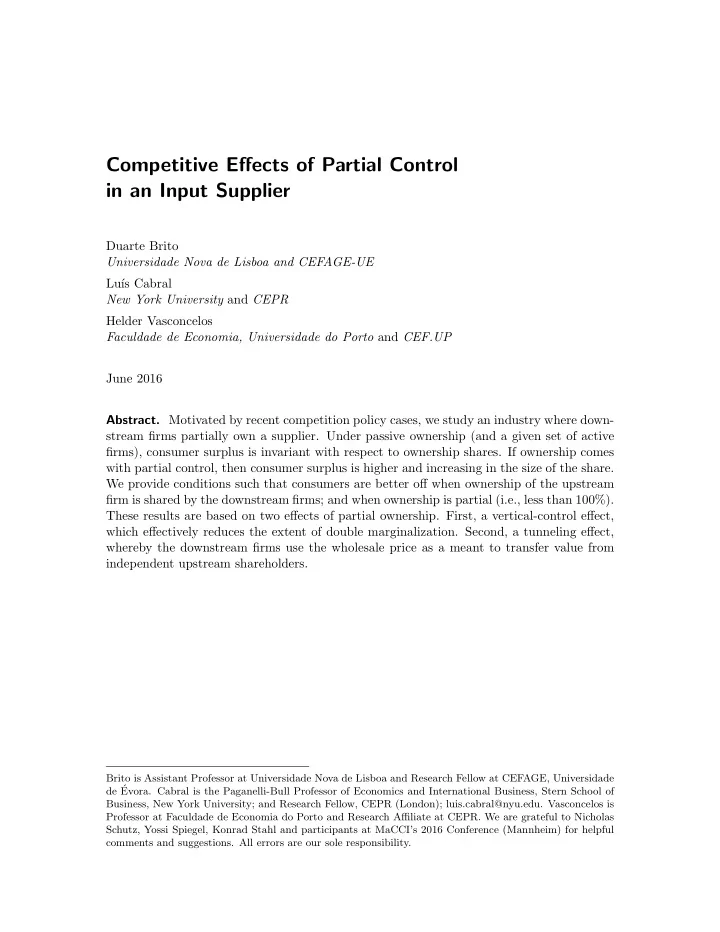
SLIDE 7 Figure 1 Output (solid lines) and wholesale price (dashed line) under passive ownership by Firm 1
1/6 1/4 1/3 1/2 2/5 1 q1, q2, Q c s
. . . . . . . . . . . . . . . . . . . . . . . . . . . . . . . . . . . . . . . . . . . . . . . . . . . . . . . . . . . . . . . . . . . . . . . . . . . . . . . . . . . . . . . . . . . . . . . . . . . . . . . . . . . . . . . . . . . . . . . . . . . . . . . . . . . . . . . . . . . . . . . . . . . . . . . . . . . . . . . . . . . . . . . . . . . . . . . . . . . . . . . . . . . . . . . . . . . . . . . . . . . . . . . . . . . . . . . . . . . . . . . . . . . . . . . . . . . . . . . . . . . . . . . . . . . . . . . . . . . . . . . . . . . . . .
Q q1 Q = q1 q2 q2 1/2 5/6 c
. . . . . . . . . . . . . . . . . . . . . . . . . . . . . . . . . . . . . . . . . . . . . . . . . . . . . . . . . . . . . . . . . . . . . . . . . . . . . . . . . . . . . . . . . . . . . . . . . . . . . . . . . . . . . . . . . . . . . . . . . . . . . . . . . . . . . . . . . . . . . . . . . . . . . . . . . . . . . . . . . . . . . . . . . . . . . . . . . . . . . . . . . . . . . . . . . . . . . . . . . . . . . . . . . . . . . . . . . . . . . . . . . . . . . . . . . . . . . . . . . . . . . . . . . . . . . . . . . . . . . . . . . . . . . . . . . . . . . . . . . . . . . . . . . . . . . . . . . . . . . . . . . . . . . . . . . . . . . . . . . . . . . . . . . . . . . . . . . . . . . . . . . . . . . . . . . . . . . . . . . . . . . . . . . . . . . . . . . . . . . . . . . . . . . . . . . . . . . . . . . . . . . . . . . . . . . . . . . . . . . . . . . . . . . . . . . . . . . . . . . . . . . . . . . . . . . . . . . . . . . . . . . . . . . . . . . . . . . . . . . . . . . . . . . . . . . . . . . . . . . . . . . . . . . . . . . . . . . . . . . . . . . . . . .
Figure 1 summarizes the results of Proposition 1 for the particular case when s2 = 0 and s1 = s. The left axis measures output levels, both firm level and total; whereas the right axis measures wholesale price. As s1 = s increases, Firm 0, anticipating that Firm 1’s effective costs is lower than c, increases the value of c, though at a lower rate than the increase in s. As a result, Firm 1 increases its output. Firm 2, facing a higher wholesale price, as well as a higher output by Firm 1, reduces its output. Firm 2’s output decrease is exactly compensated by Firm 1’s increase, so that total output Q remains constant. If s is greater than 2
5, then Firm 0 finds it optimal to increase wholesale price so that
Firm 2 is effectively excluded from the market. The assumption that Firm 0 is unable to price discriminate between Firms 1 and 2 plays an important role here (as we will see in greater detain in Section 5). Firm 0 would like to increase Firm 1’s cost by a greater amount, for since Firm 1 owns a share in Firm 0 Firm 1 is less sensitive to increases in wholesale price. We thus have a discontinuity in Firm 0’s optimal strategy: once it decides to set a c that forecloses Firm 0, it increases c to the Firm 1 optimal level. If the assumptions in this section were true, then we would expect Sport TV and Zon to squeeze PT out of the cable market by setting a high wholesale price. (Recall that Zon’s share s is greater than 2
5, the critical threshold in Proposition 1.) We know that PT
(and a much smaller rival) have not been squeezed out of the Portuguese cable market. The difference between model and reality may be reconciled in several ways. First, the threshold value s = 2
5 depends on the particular functional form we considered, namely
linear demand. In Section 5 we consider the extension to a non-linear demand curve. Second, price competition may be a better description of the retail competition mode. In Section 5 we consider the extension to price competition at the retail level. Finally, and more important, the assumption of passive ownership may be unwarranted; and as we show in the next section, foreclosure fails to take place when Firm 1 has (partial) control over Firm 0. 6