Comparison between ICRP Recommendations and Dose Limits Domestic - - PowerPoint PPT Presentation

comparison between icrp recommendations and
SMART_READER_LITE
LIVE PREVIEW

Comparison between ICRP Recommendations and Dose Limits Domestic - - PowerPoint PPT Presentation

Comparison between ICRP Recommendations and Dose Limits Domestic Laws and Regulations Occupational exposure Public exposure Laws and regulations Laws and regulations concerning the 2007 concerning the 2007 prevention of Recommendations


slide-1
SLIDE 1

Comparison between ICRP Recommendations and Domestic Laws and Regulations

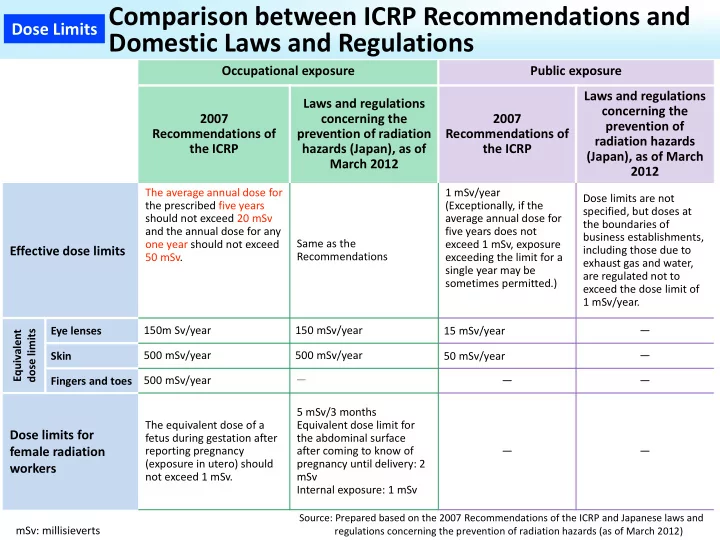
Occupational exposure Public exposure 2007 Recommendations of the ICRP Laws and regulations concerning the prevention of radiation hazards (Japan), as of March 2012 2007 Recommendations of the ICRP Laws and regulations concerning the prevention of radiation hazards (Japan), as of March 2012 Effective dose limits

The average annual dose for the prescribed five years should not exceed 20 mSv and the annual dose for any

  • ne year should not exceed

50 mSv. Same as the Recommendations 1 mSv/year (Exceptionally, if the average annual dose for five years does not exceed 1 mSv, exposure exceeding the limit for a single year may be sometimes permitted.) Dose limits are not specified, but doses at the boundaries of business establishments, including those due to exhaust gas and water, are regulated not to exceed the dose limit of 1 mSv/year. Equivalent dose limits Eye lenses 150m Sv/year 150 mSv/year 15 mSv/year ― Skin 500 mSv/year 500 mSv/year 50 mSv/year ― Fingers and toes 500 mSv/year - ― ―

Dose limits for female radiation workers

The equivalent dose of a fetus during gestation after reporting pregnancy (exposure in utero) should not exceed 1 mSv. 5 mSv/3 months Equivalent dose limit for the abdominal surface after coming to know of pregnancy until delivery: 2 mSv Internal exposure: 1 mSv ― ― mSv: millisieverts

Source: Prepared based on the 2007 Recommendations of the ICRP and Japanese laws and regulations concerning the prevention of radiation hazards (as of March 2012)

Dose Limits

slide-2
SLIDE 2

ICRP Recommendations and Responses of the Japanese Government

2007 Recommendations of the ICRP Responses at the time of the accident at Tokyo Electric Power Company (TEPCO)'s Fukushima Daiichi NPS

Occupational exposure

Rescue activities (Volunteers who have

  • btained the relevant

information) When benefits for other people outweigh the rescuers' risks, dose limits are not applied. Special Provisions of the Ordinance on Prevention of Ionizing Radiation Hazards (Ministry of Health, Labour and Welfare) The emergency exposure dose limit was temporarily raised to 250 mSv from the conventional level of 100 mSv (from March 14 to December 16, 2011). The Ordinance on Prevention of Ionizing Radiation Hazards was partially amended to raise the exceptional emergency dose limit to 250 mSv (enforced on April 1, 2016). Other emergency activities Up to 500 mSv

Public exposure

Emergency exposure situations The limit is to be set within the range of 20 to 100 mSv/year. e.g. Standards for evacuation in Deliberate Evacuation Areas: 20 mSv/year Reconstruction period (Existing exposure situations) The limit is to be set within the range of 1 to 20 mSv/year. e.g. Additional exposure dose to be achieved in the long term: 1 mSv/year

mSv: millisieverts

Source: Prepared based on the 2007 Recommendations of the ICRP and the Special Provisions of the Ordinance

  • n Prevention of Ionizing Radiation Hazards (Ministry of Health, Labour and Welfare: MHLW)

Dose Limits

slide-3
SLIDE 3

Comparison of Regulation Values for Foods

* The Codex Alimentarius Commission is an intergovernmental body created in 1963 by the Food and Agriculture Organization of the United Nations (FAO) and the World Health Organization (WHO) for the purpose of protecting consumers' health and ensuring fair‐trade practices in the food trade, etc.; The Commission establishes international standards for foods. * Standard limits incorporate effects of the amount of food intake and assumed percentages of foods containing radioactive materials. Therefore, the values are not suitable for inter‐comparison. * Indicated standard limits for drinking water are the WHO guidance levels of radioactive materials, which are referred to in respective countries, and standard limits for radioactive materials vary by country due to differences in adopted preconditions. Therefore, the values are not suitable for inter‐comparison.

Indices concerning radioactive materials in foods (Bq/kg)

Source: Prepared based on "Food and Radiation Q&A," Consumer Affairs Agency

Dose Limits

Radionuclide Japan

Codex Alimentarius Commission

EU US Milk Infant foods General foods 50 50 100 Radioactive cesium Infant foods General foods 1,000 1,000 Milk Infant foods General foods 1000 400 1,250 All foods 1,200 Upper limits for additional doses Assumed percentages of foods containing radioactive materials

1mSv 1mSv 1mSv 5mSv 50% 10% 10% 30%

slide-4
SLIDE 4

Relation between Exposure Doses and Health Risks

Lower than the level of

risks due to natural radiation

Deterministic effects Significant cancer risks

1 20

(mSv/year)

100

The level of cancer risks is unknown

(or minor if any).

Range of reference levels in an emergency Range of reference levels in a recovery and reconstruction period

Source: Prepared based on the 2007 Recommendations of the ICRP

Cumulative lifetime exposure

doses below 100 mSv

Dose Limits