
SLIDE 1
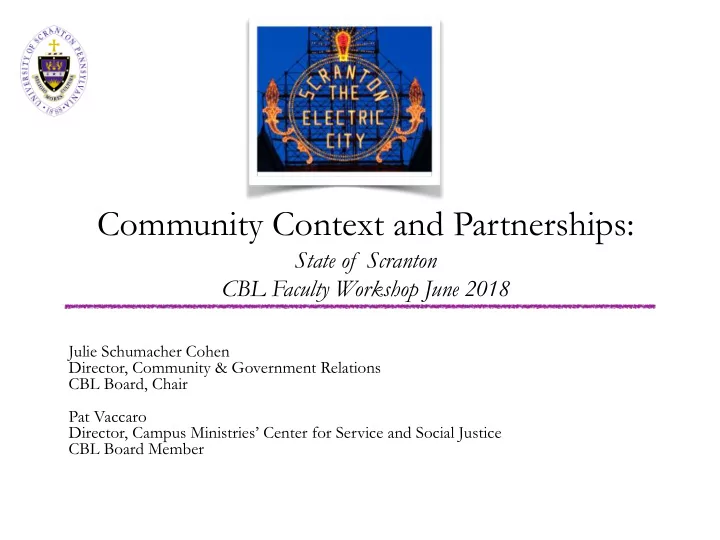
Community Context and Partnerships:
State of Scranton CBL Faculty Workshop June 2018
Julie Schumacher Cohen Director, Community & Government Relations CBL Board, Chair Pat Vaccaro Director, Campus Ministries’ Center for Service and Social Justice CBL Board Member