SLIDE 2 Community Characteristics: Aggregate
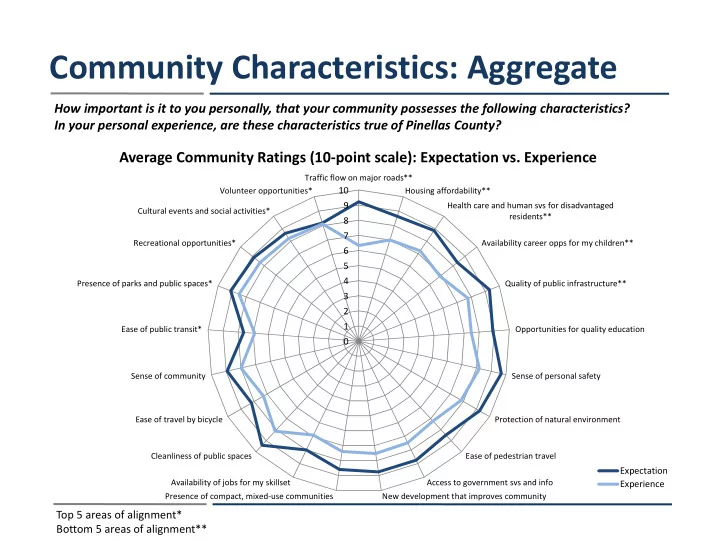
- Community characteristics with strongest perceived alignment: Volunteer opportunities, Cultural events
and social activities, and Recreational opportunities.
- Community characteristics with weakest perceived alignment: Availability of career opportunities for my
children, Health care and human services for disadvantaged residents, Housing affordability, and Traffic flow on major roads.
Note: Bold reflects top 5 characteristics for average expectation and experience ratings. Blue represents best perceived alignment and grey represents community characteristics for weakest alignment.
Expectation Experience Ratio 2015 2014 2013 2012 2015 2014 2013 2012 2015 2014 2013 2012 Volunteer opportunities 8.18 8.23 7.76 8.26 8.12 8.17 7.79 7.47 0.99 0.99 1.00 0.90 Cultural events and social activities 8.63 8.86 8.09 8.35 8.22 8.23 7.68 7.56 0.95 0.93 0.95 0.91 Recreational opportunities 8.87 9.03 8.59 8.55 8.35 8.40 8.01 7.72 0.94 0.93 0.93 0.90 Presence of parks and public spaces 9.10
- 8.51
- 0.93
- Ease of public transit
7.64 7.58 7.50 8.24 6.91 7.19 6.65 6.70 0.91 0.95 0.89 0.81 Sense of community 8.93 8.98 8.36 8.52 7.99 7.99 7.39 7.08 0.89 0.89 0.88 0.83 Ease of travel by bicycle 8.20 7.97 7.63 8.11 7.28 7.31 6.75 6.57 0.89 0.92 0.88 0.81 Cleanliness of public spaces 9.41 9.40 9.19 9.02 8.14 8.14 7.76 7.58 0.87 0.87 0.84 0.84 Availability of jobs for my skillset 8.00 8.82
7.35
0.83
- Presence of compact, mixed-use communities
8.59 8.79
7.78
0.89
- New development that improves the community
8.76 8.62
7.68
0.89
- Access to government services and information
8.75
- 7.48
- 0.85
- Ease of pedestrian travel
8.49 8.14 7.98 8.32 7.23 7.34 6.79 6.59 0.85 0.90 0.85 0.79 Protection of natural environment 9.24 9.28 8.95 8.74 7.84 8.11 7.53 7.39 0.85 0.87 0.84 0.85 Sense of personal safety 9.68 9.51 9.39 9.23 8.19 8.22 7.67 7.45 0.85 0.86 0.82 0.81 Opportunities for quality education 8.91 9.16 9.04 9.09 7.47 7.74 7.29 6.90 0.84 0.85 0.81 0.76 Quality of public infrastructure 9.30 9.23 8.98 8.85 7.76 7.98 7.41 7.34 0.83 0.86 0.83 0.83 Availability of career opportunities for my children 8.35 9.07
7.47
0.82
- Health care and human svs for disadvantaged residents
8.85 8.56 8.67
7.53 7.10
0.88 0.82
8.65 8.52 8.54 8.62 7.00 7.35 7.00 6.60 0.81 0.86 0.82 0.77 Traffic flow on major roads 9.22 9.17 8.95 8.88 6.33 6.66 6.26 6.17 0.69 0.73 0.70 0.69
Strongest alignment Weakest alignment