
w w w .farm docdaily.illinois.edu w w w .farm doc.illinois.edu
Commodity Market Outlook
Todd Hubbs jhubbs3@Illinois.edu Department of Agricultural and Consumer Economics University of Illinois
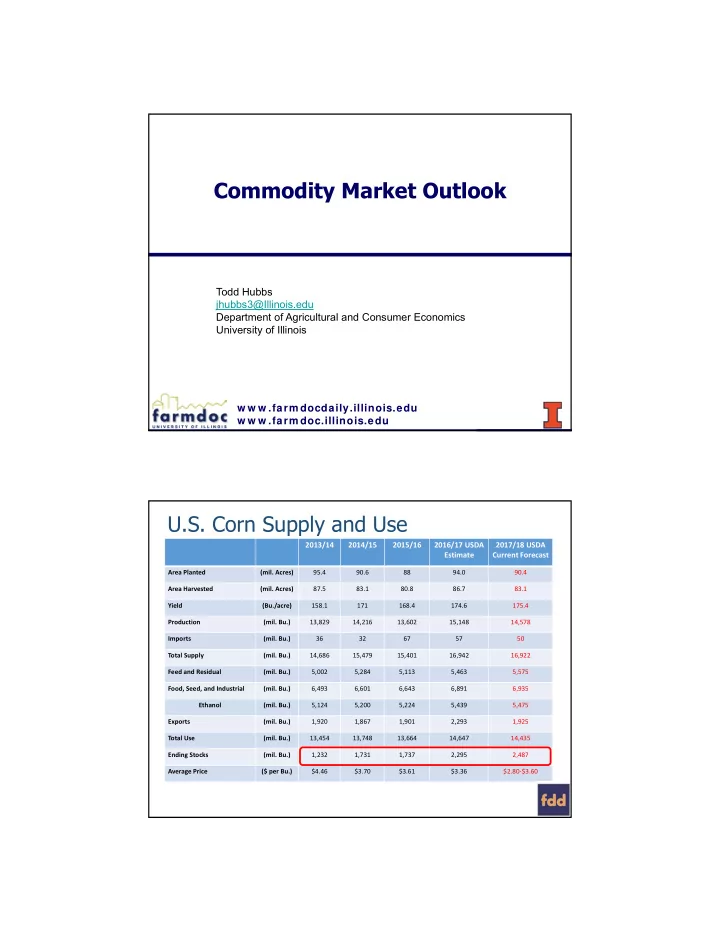
U.S. Corn Supply and Use
2013/14 2014/15 2015/16 2016/17 USDA Estimate 2017/18 USDA Current Forecast
Area Planted (mil. Acres) 95.4 90.6 88 94.0 90.4 Area Harvested (mil. Acres) 87.5 83.1 80.8 86.7 83.1 Yield (Bu./acre) 158.1 171 168.4 174.6 175.4 Production (mil. Bu.) 13,829 14,216 13,602 15,148 14,578 Imports (mil. Bu.) 36 32 67 57 50 Total Supply (mil. Bu.) 14,686 15,479 15,401 16,942 16,922 Feed and Residual (mil. Bu.) 5,002 5,284 5,113 5,463 5,575 Food, Seed, and Industrial (mil. Bu.) 6,493 6,601 6,643 6,891 6,935 Ethanol (mil. Bu.) 5,124 5,200 5,224 5,439 5,475 Exports (mil. Bu.) 1,920 1,867 1,901 2,293 1,925 Total Use (mil. Bu.) 13,454 13,748 13,664 14,647 14,435 Ending Stocks (mil. Bu.) 1,232 1,731 1,737 2,295 2,487 Average Price ($ per Bu.) $4.46 $3.70 $3.61 $3.36 $2.80‐$3.60