
SLIDE 1
Co-Authors Isaac Aboulafia PE Doug Carvel PE Larry Rader PG - - PowerPoint PPT Presentation
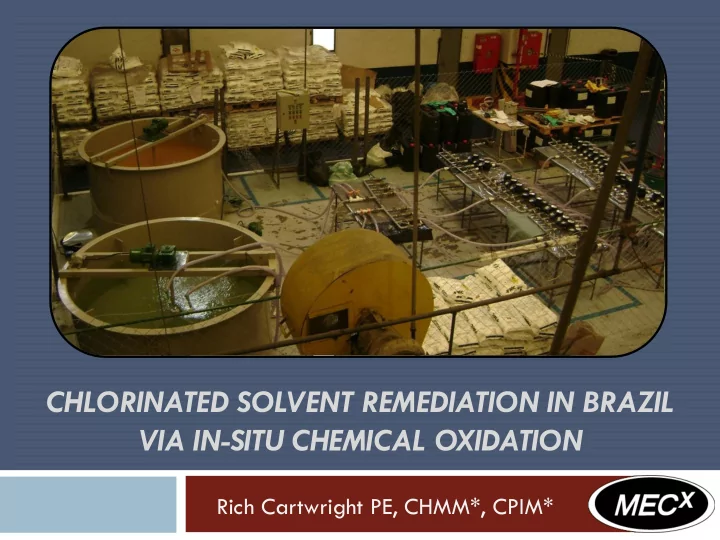
CHLORINATED SOLVENT REMEDIATION IN BRAZIL VIA IN-SITU CHEMICAL OXIDATION Rich Cartwright PE, CHMM*, CPIM* Co-Authors Isaac Aboulafia PE Doug Carvel PE Larry Rader PG Facility Overview Active manufacturing of pots/pans
Isaac Aboulafia PE Doug Carvel PE Larry Rader PG
Active manufacturing of pots/pans Historical release of tetrachloroethylene (PCE) PCE affected nearby drinking water wells Two affected zones
4-9 m: sandy clay 9-12 m: clay
Pre-ISCO pump
SCALE (m): 10 40 20
Pressure & temperature control Vertical contaminant migration Chemical storage and safety Operational interruptions
Safety culture Lack of ISCO experience Chemical handling Language, hand signals, etc. Units of measure Logistics for equipment & chemicals
Oxidant and reagent screening Continuous dosage refinement
1.
2.
3.
(1) = Provided by FMC Corporation
Presence of transition metal Heat (> 40oC) Hydrogen peroxide (H2O2) Alkaline conditions (high pH)
50 70 90 110 130 150 170 190 1 2 3 4 5 6 7 8 9 10 11 12 13 14 15 Days Temperature ( 0F)
Monitoring Well CleanOX App. Well
1. determine reactivity of the site media 2. select the optimum reagent formulation 3.
reactive with most metals highly acidic (pH < 2) requires careful handling/use
stored in cool/dry area injection solution homogenized in vented,
Flammability
Health
Reactivity
Target treatment Area: 2,000 m2 38 injection wells total
16 multi-level injection 22 single-level injection
1,500 m of hose 30 tons of chemicals applied 10 days of reagent application
5 levels of flow control
10 days of safe injection 75% reduction in contaminant mass Area reduced
2,000 m2 (~½ acre) to 200 m2 (~2,000 ft2)
Well Pre-ISCO PCE (9/2009) PCE Post-ISCO (4/2010) PCE Reduction (ug/L) (ug/L) (ug/L) % MW-14 1,200 ND 1,200 100% MW-15 12,330 3,552 8,778 71% MN-10 34,105 8,875 25,230 74% MW-19 50 45 5 10% MW-25 10,553 4,373 6,180 59% MW-26 3,950 3,489 461 12% MW-27 3,950 1,092 2,858 72% MW-28 493 591 (98)
MW-29 9 ND 9 100% =Treatment goal met after 1st application Average: 62%