Climatology of tropospheric CO 2 observed by CONTRAIL- CME Taku - - PowerPoint PPT Presentation

climatology of tropospheric co 2 observed by contrail cme
SMART_READER_LITE
LIVE PREVIEW

Climatology of tropospheric CO 2 observed by CONTRAIL- CME Taku - - PowerPoint PPT Presentation

Climatology of tropospheric CO 2 observed by CONTRAIL- CME Taku Umezawa 1 , Toshinobu Machida 1 , Hidekazu Matsueda 2 , Yousuke Sawa 2 and Yosuke Niwa 2 1 National Institute for Environmental CONTRAIL Sticker Available! Studies 2 Meteorological


slide-1
SLIDE 1

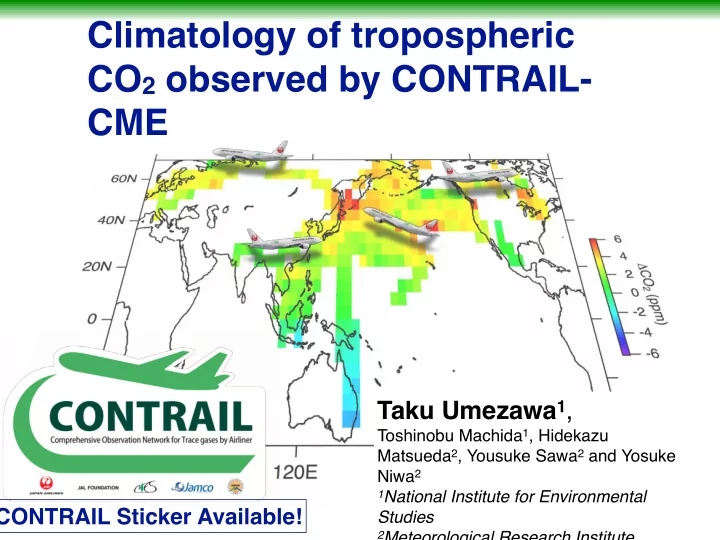
Climatology of tropospheric CO2 observed by CONTRAIL- CME

Taku Umezawa1,

Toshinobu Machida1, Hidekazu Matsueda2, Yousuke Sawa2 and Yosuke Niwa2

1National Institute for Environmental

Studies

2Meteorological Research Institute

CONTRAIL Sticker Available!

slide-2
SLIDE 2

What we see in the free troposphere

Niwa et al. (2012, JGR) 250 hPa Surface Sawa et al. (2012, JGR)

CONTRAIL CME data for 2005–2010:

  • Number of flight ~5000
  • Number of CME data ~3 millions
  • Analysis grid 20° x 10°
  • Vertical gradient was not analysed

in detail. NICAM model illustrates how a source signal propagates in the atmosphere.

slide-3
SLIDE 3
  • Distribution of CO2 in the atmosphere is key information for better

understanding of the global carbon cycle.

  • Latitudinal gradient (e.g. Denning et al. 1995)
  • Vertical gradient (e.g. Stephens et al. 2007)
  • There are data-scarce regions where stable station measurements

are still almost infeasible.

  • CONTRAIL can fill the data gap extensively.

—and the data have been indeed used to infer surface fluxes (e.g. Niwa et al. 2012; Basu et al. 2014; Zhang et al. 2015).

  • Yet complete description of the CONTRAIL-provided atmospheric CO2

distribution (including updates and more of Sawa et al. 2008, 2012) has not be given.

  • In this presentation, we focus on CONTRAIL data in Asia-Pacific

regions.

Motivation

slide-4
SLIDE 4

Forward'Cargo'Room CME: Continuous CO2 Measuring Equipment Af'Cargo'Room ASE: Automatic Air Sampling Equipment, for CO2, CH4, CO, N2O, SF6, H2, isotopes

CONTRAIL Project since 2005

Comprehensive Observation Network for Trace gases by Airliner

slide-5
SLIDE 5

An example of CME data

1 data per 10 sec during ascent/descent 1 data per 1 min during level flight

slide-6
SLIDE 6

Flight routes with CME (Nov. 2005–Dec. 2014)

~12,000 flights ~23,000 vertical profiles ~7.0 million data

1. NRT, Japan 7270 2. HND, Japan 2937 3. SYD, Australia 1581 4. HNL, Hawaii 1455 5. BKK, Thailand 1273 6. NGO, Japan 855 7. DEL, India 787 8. SIN, Singapore 686 9. CDG, France 683

  • 10. KIX, Japan 635
  • 11. YVR, Canada 440
  • 12. CGK, Indonesia 422
  • 13. DME, Russia 409
  • 14. SFO, California 366
  • 15. AMS, the Netherlands 238
  • 16. ICN, South Korea 199
  • 17. LHR, UK 196
  • 18. FUK, Japan 189
slide-7
SLIDE 7

ΔCO2 = CO2 (CONTRAIL NRT) - CO2 trend at MLO

Increase in winter–spring Decrease in summer

  • Seasonal cycle of CO2 is not vertically uniform (altitude

dependent).

  • Vertical gradient of CO2 varies seasonally.
slide-8
SLIDE 8

Vertical gradient varies with season:

  • large in winter
  • vertically uniform in

summer.

ΔCO2 composite analysis over Tokyo, Japan

slide-9
SLIDE 9

ΔCO2 over East Asia

Seoul Tokyo Osaka Fukuoka East Asian pattern is characterised by

  • Increase over winter–spring
  • Summer decrease pronounced

in the free troposphere

slide-10
SLIDE 10

ΔCO2 over Delhi, India

“East Asian pattern” “Monsoon”

pre-Monsoon Monsoon 0–2 km 4–6 km 8–10 km DEL

slide-11
SLIDE 11

Distribution of annual average ΔCO2

DME AMS LHR YVR CDG PEK DEL ICN NRT etc. SHA HKG HNL BKK SIN CGK SYD LHR CDG AMS DME DEL BKK SIN CGK HKG PEK SHA ICN NRT etc. SYD HNL YVR

✓ Large Longitudinal gradient ✓ Vertical gradient is large in East

Asia

✓ Large latitudinal gradient near the

surface

✓ Vertical gradient is large at mid

latitudes

✓ Opposite vertical gradients in the NH

and SH

slide-12
SLIDE 12

Summary

  • Large number of the CONTRAIL CME data enables us to

illustrate climatological distributions of tropospheric CO2, particularly for Asia/Pacific regions.

  • Seasonal cycles/vertical profiles are well characterised.
  • Different patterns are obvious at areas in upstream/

downstream of continental sources/sinks.

  • Extensive CO2 data are available and can push data

assimilation powerfully.

  • For data use, see the CONTRAIL website !

(Visit www.cger.nies.go.jp/contrail/ or google “CONTRAIL NIES”)