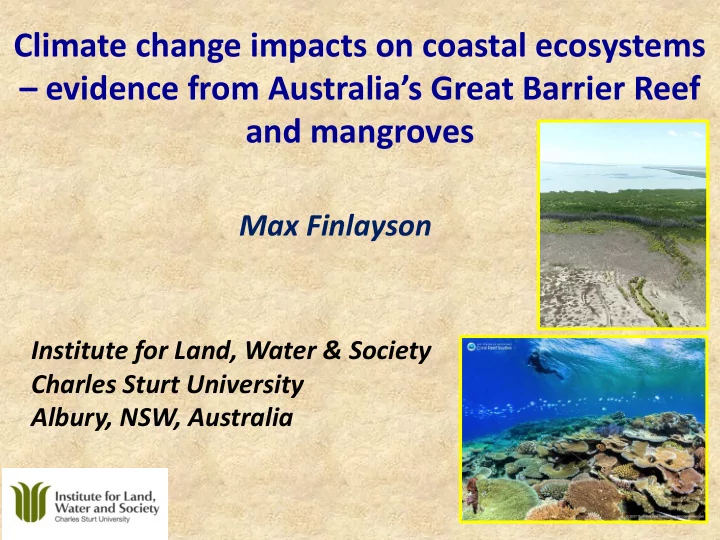

Climate change impacts on coastal ecosystems – evidence from Australia’s Great Barrier Reef and mangroves Max Finlayson Institute for Land, Water & Society Charles Sturt University Albury, NSW, Australia
Overview • Two examples of massive environmental change - Coral bleaching along the Great Barrier Reef in eastern Australia - Mangrove dieback in Kakadu National Park in northern Australia • World Heritage listed sites – iconic conservation parks subject to threat of international sanction (World Heritage in Danger) • Changes in the ecology and ecosystem services or benefits available to local people and visitors • Drivers – global climate change (?) • Responses – international policy action
Kakadu National Park Great Barrier Reef
Coral bleaching Coral bleaching occurs when abnormal environmental conditions, like heightened sea temperatures cause corals to expel tiny photosynthetic algae, called ‘zooxanthellae’. The loss of these colourful algae causes the corals to turn white, and ‘bleach’. Bleached corals can recover if the temperature drops and zooxanthellae are able to recolonise them, otherwise the coral may die.
Surveying healthy reefs
Bleached corals
Graveyard of Staghorn coral, Yonge reef, Northern … Reef Studies.jpg
June 2017
Mangroves and Climatic Fluctuations • Dieback of mangroves along much of the northern Australian coastline in 2015/2016 ca. 10,000 ha • Concerns about the impact of climate-related phenomena on the long-term integrity and viability of this ecosystem • Primary drivers of change are: – Fluctuations in sea level – Rising temperatures – Increased storm intensity and frequency – Changes in rainfall and inundation Duke et al. 2017. Marine and Freshwater Research
Beyond the Gulf: Kakadu National Park • Iconic park, World Heritage, co- managed with indigenous owners; 20,000 ha • Landsat data in 2000 - mangroves occupied 120.2 km 2 • Occurred along the rivers and the coastline of the mainland and islands • Dominated by Avicennia marina, Rhizophora stylosa , Sonneratia alba and Mixed Forests • Landward and seaward margins are typically lower than the intermediate zone, which can exceed 25 m in height
Kakadu mangrove baselines - extent and height (1m orthomosaics & DEMs) 1984 1991 1950
Sonneratia Avicennia Rhizophora
Changes in mangrove extent and cover between 1991 and 2012, Kakadu National Park
Historical Temperature and Sea Level Fluctuation 35 4.6 Sea Surface Temperature ( o C) 4.5 30 Mean Sea Level (m) 4.4 25 4.3 20 4.2 15 4.1 10 4 SST SeaLevel 12 per. Mov. Avg. (SeaLevel) 12 per. Mov. Avg. (SST) 5 3.9 1985 1990 1993 1997 2000 2004 2007 2011 Year 1013 4.4 90 4.4 Total Mangrove Area Sea Level Mean sea level pressure 80 Mangrove Area (km 2 ) Mean Sea Level Pressure (hPa) Mean sea level (m) 70 4.3 1012 4.3 Sea Level (m) 60 Mean Sea Level (m) 50 4.2 40 1011 4.2 30 4.1 20 10 1010 4.1 0 4 1987 1992 1997 2002 2007 2013 Landsat-derived estimates of area with Foliage 1009 4 1990 1995 2000 2005 2010 2015 Projective Cover of > 30 % for the West Alligator River Year mangroves
Mangrove dieback in Kakadu NP (2014-2016) During September, 2016, a field campaign using combinations of drone and airborne survey to establish the characteristics of mangroves occurring in the upper reaches of creeks in terms of structure and species composition Ground and Drone Significant dieback was observed . 24.73 km 2 Observations of Mangroves dieback / 21% of total area Kakadu NP
Time-Series of Rapid Eye Data, Kakadu NP 2014 • Dieback is in areas dominated by Avicennia marina • Most mangroves are of relatively low (< 5 m) 2016 stature • The majority occurs on the inland sections
Mangrove Dieback Mapped From Time-series of RapidEye NDVI data Is dieback permanent or temporary? Cyclic? Mangrove dieback in 2016 from a 2014 baseline
Integration of LIDAR and RapidEye, Kakadu NP RapidEye NIR, Red Edge and Red Reflectance Bands showing dominance of Avicennia marina (landward edge), Rhizophora stylosa (central zone) and Sonneratia alba (seaward edge) Comparison of the RapidEye NDVI from 2014 and 2016 indicates extensive dieback in low (< 5 m) stature forests dominated by A. marina . Observations of mangrove dieback (primarily A. marina ) observed from helicopter in September 2016
Causes and Consequences of Change? Flooding by freshwater flows? Sea level rise / changes in tides? Causes of the change can be attributed to an adverse deviation in prevailing environmental conditions and may be a consequence of human-induced climate change – temperature, rainfall and Increasing temperatures? flooding, tidal depression……
Conclusions - mangroves • Recent dieback event in Kakadu NP defied the trends of mangrove expansion that had been observed in previous decades • The extent of dieback is worrying because all mangroves in Australia have a high degree of protection and those in the north have not been cleared or significantly degraded by humans • Whilst there has been justified alarm about the dieback of mangroves, we have evidence that such changes might have occurred in past decades, albeit not to the same severity, extent and rapidity, or have been noticed • May even have been more severe changes in the past ….. with expected rise in sea level the mangroves are expected to recover and extend further inland into the adjoining freshwater wetlands
Management options for tropical reefs and mangroves § Local restoration and management actions to build resilience; knowledge based § National / International policy responses beyond local politics & economies
Recommend
More recommend