
SLIDE 1
Clean Energy investor Group AEMC Pre-Determination Hearing - 4 - - PowerPoint PPT Presentation
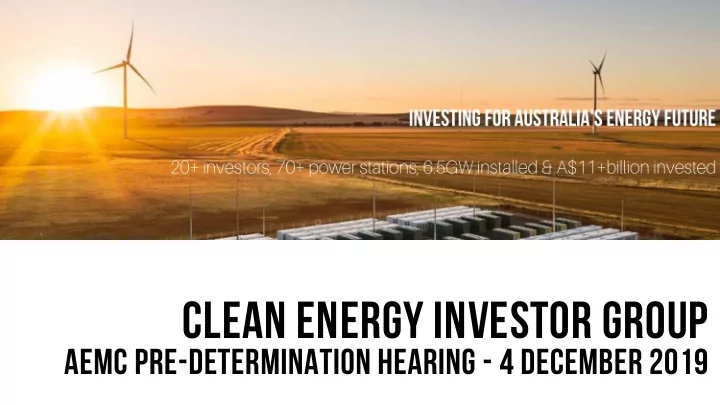
Clean Energy investor Group AEMC Pre-Determination Hearing - 4 December 2019 W H O W E A R E Fo r med in J u l y 2019 Comp r i s ing 20 in v e st o rs o w ning 72 po w e r st a t ion s , comp r i s ing 6 . 5 GW of in st alled capaci ty and
Page 1.
Page 2.
Are not proving fit for purpose for this version of the NEM... So the Streetlight Effect... Is causing RE investment to fall off a cliff.... Source: Clean Energy Council September 2019 Page 3.
By 2040, need to invest $72 billion to deliver the isp
MLF impact on delivery cost of the ISP*Option 2: CEIG Members stop investing & left to
extra per customer
ISP "NEM 2.0"
Option 1: ceig members keep investing & include (+2%) MLF premium^ = $430 extra per customer
* CEIG calculations based on AEMO's 2018 ISP ^ CEIG survey of WACC and risk premiums ^^ 4-5% cost of equity delta to CEIG
Page 4.
Substantially reduced volatility of loss factors year on year Dampens impact of errors inherent in long-term forecasts Preserves the relative locational signal Creates sufficient certainty to continue to invest Is used in many other markets, e.g. Canada, USA & UK Delivers improved long term customer outcomes Changing to ALF: Page 5.
The AEMC argued strongly for (i) dispatch efficiency and (ii) locational signalling as the basis for maintaing the status quo MLF position (i) Dispatch Efficiency The academic thinking goes that accurate (be it MLF or DRP) loss factor representation provides a signal about where to build new generators. However dispatch outcomes provide no leading indicator for investors. The potential increase in losses for a new generator is not at all obvious just by observing historical loss factors. The current locational signals MLF provides are simply saying “do not invest in the NEM, unless it’s right next to a capital city”. In the new distributed NEM (with and without REZ's) building wind and solar where the resource is strong, where land is cheap, and where it benefits the community the strongest is the best option for consumers as the resource intensity benefit outweighs the transmission loss cost. Based on recent announcements by NSW, most new transmission and therefore generation locational signalling will be achieved through a government-led central planning approach to the REZ's. (ii) Locational Signalling Most importantly, no quantitative economic or financial analysis was undertaken by AEMC to demonstrated that the (i) disptch efficiency and (ii) locational signally benefits of MLF outweigh the supply side benefits of ALF. When it comes to making a decision in the best interests of consumers and the NEO, this MUST be done. Locational signalling effect: ? per customer
MLF
Dispatch efficiency effect: ? per customer
I N S U M M A R YPage 6.
CONSUMER PRICES
ALF
CEIG & Baringa quantitative modelling shows ALF is better for consumer prices and the NEO. We remain open to being proven wrong.....Supply-side effect: ~$100p.a. per customer Bid stack effect*: $10-25p.a. per customer
IRSR / TUOS netback effect: ? per customer
Page 7.
The CEIG and its members want to work with AEMC to quantitatively analyse the relative merits of the MLF and ALF frameworks. Specifically:Work with AEMC and AEMO to establish a reference data set Agree framework to assess impact on operational efficiency Agree framework to assess impact on efficient investment and locational signals based on expected approach to REZ delivery Agree framework to assess impact of supply side (driven by investor certainty) effects Share and review results of analysis
Thank you for your attention! Q&A? RE Penetration Wholesale: 17% 9% 51% 95% 17% Rooftop: 20% 36% 35% 15% 18%
A P P E N D I XPage 8.
States with high new renewable energy investment and penetration have falling prices ($/MWh)*, but most volatile MLF...* AEMO: https://www.aemo.com.au/Electricity/National-Electricity-Market-NEM/Data-dashboard#average-price-table