
SLIDE 1
208 Patterns Physics Electricity, Magnetism, & Power Production
Skeleton of a Conclusion:
Claim Evidence Mathematical Model
with Reasoning about the Constant, the Pattern, and General Equation
Claim Evidence Mathematical Model with Reasoning about the - - PowerPoint PPT Presentation
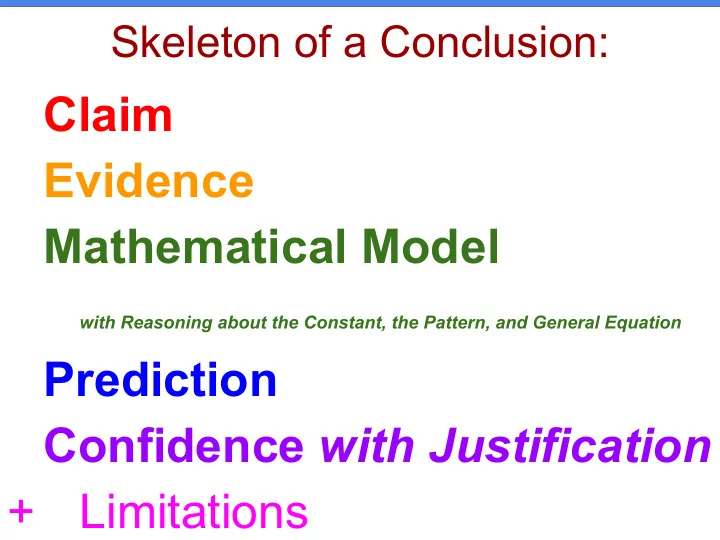
Skeleton of a Conclusion: Claim Evidence Mathematical Model with Reasoning about the Constant, the Pattern, and General Equation Prediction Confidence with Justification + Limitations 208 Patterns Physics Electricity, Magnetism, &
208 Patterns Physics Electricity, Magnetism, & Power Production
with Reasoning about the Constant, the Pattern, and General Equation
Clearly state your conclusion.
Explain how the data you cite supports your claim.
Communicate the mathematical model that behaves the same as the system you investigated. Along with the model you need to describe your reasoning about 1) what the A-value represents in the real world and 2) why the pattern makes sense. Be sure to also include 3) the generalized equation (in all words).
Communicate how the system you behave for the scenario presented at the beginning of the experiment.
Explain your thinking for your confidence in using your data to predict the future behavior of the system.
Evaluate the limitations of either your procedure to collect data or of the model your created of the system you investigated.
Exemplar Conclusion from Past Experiment: After investigating speeding up of a ball down a ramp in order to determine a mathematical model for constant acceleration, I conclude that there is a quadratic relationship between the distance the object moves and the time is has moved. My evidence for this claim is that all five of my data points over a 3 m range all fit on a single best-fit curve that is quadratic. This system of an accelerating object from rest can be mathematically modeled as: Distance Travelled = 0.3 m/s /s * time2 where the 0.3 m/s /s is how much the ball is speeding up each second. It makes sense that the pattern is quadratic because time affects both how long the ball has rolled and how much it has speed up. So in general for an object accelerating from the model will be Distance Travelled = ½ acceleration * time x time Using data from the 30 cm high ramp groups, I predict for a ball rolling for 4 seconds that it will travel a distance of 4.80 (+/- 0.05) m. My confidence for this prediction is only medium-high, since the best-fit line hits near the center of most of my data points but the prediction is outside their data range. One limitation of our procedure was that our ramp was not straight, now that I understand acceleration better I can reason that where the ramp was bowed down the ball would accelerate faster than where is was slightly bowed up, which would make for data points respectively above and below the best fit curve.
211 Patterns Physics Electricity, Magnetism, & Power Production
212 Patterns Physics Electricity, Magnetism, & Power Production
213 Patterns Physics Electricity, Magnetism, & Power Production
Activity: 6Extension - Wave / Particle Duality
214 Patterns Physics Electricity, Magnetism, & Power Production
Activity: 6Extension - Wave / Particle Duality
215 Patterns Physics Electricity, Magnetism, & Power Production
216 Patterns Physics Electricity, Magnetism, & Power Production
217 Patterns Physics Electricity, Magnetism, & Power Production
218 Patterns Physics Electricity, Magnetism, & Power Production
219 Patterns Physics Electricity, Magnetism, & Power Production
220 Patterns Physics Electricity, Magnetism, & Power Production
221 Patterns Physics Electricity, Magnetism, & Power Production
222 Patterns Physics Electricity, Magnetism, & Power Production
A bit Oversimplified: Air at the equator warms, rises, and is pushed from the following air behind it to the poles, where it cools, sinks and flows back to the equator to repeat
Simple, single cell atmospheric convection in a non-rotating Earth. "Single cell" being either a single cell north or south of the equator. Figure 7.5 in The Atmosphere, 8th edition, Lutgens and Tarbuck, 8th edition, 2001.
223 Patterns Physics Electricity, Magnetism, & Power Production
Remember the earth’s surface varies and it is really big and spinning
Idealized, three cell atmospheric convection in a rotating Earth. "Three cell" being either three cells north or south
Figure 7.5 in The Atmosphere, 8th edition, Lutgens and Tarbuck, 8th edition, 2001.
224 Patterns Physics Electricity, Magnetism, & Power Production
Source: serc.carleton.edu
225 Patterns Physics Electricity, Magnetism, & Power Production
A Peak at an animated representation.
Source: http://montessorimuddle.org/
226 Patterns Physics Electricity, Magnetism, & Power Production
A Peak at another representation. Why is Oregon so mild in winter vs Minnesota at the same latitude?
Figure 7.9 in The Atmosphere, 8th edition, Lutgens and Tarbuck, 8th edition, 2001.
227 Patterns Physics Electricity, Magnetism, & Power Production
A Peak at another representation. Why is Oregon so mild in summer vs. Minnesota at the same latitude?
Figure 7.9 in The Atmosphere, 8th edition, Lutgens and Tarbuck, 8th edition, 2001.
228 Patterns Physics Electricity, Magnetism, & Power Production
Annotate your Sankey Diagram in your Packet
229 Patterns Physics Electricity, Magnetism, & Power Production
Light energy from the sun.
230 Patterns Physics Electricity, Magnetism, & Power Production
Light energy from the sun. Light energy reflected by clouds, ice, water, and land.
231 Patterns Physics Electricity, Magnetism, & Power Production
Light energy from the sun. Light energy reflected by clouds, ice, water, and land. Light energy is transferred into the ground as thermal energy.
232 Patterns Physics Electricity, Magnetism, & Power Production
Light energy from the sun. Light energy reflected by clouds, ice, water, and land. Light energy is transferred into the ground as thermal energy. Thermal energy is emitted by the surface of the Earth.
233 Patterns Physics Electricity, Magnetism, & Power Production
Light energy from the sun. Light energy reflected by clouds, ice, water, and land. Light energy is transferred into the ground as thermal energy. Thermal energy is emitted by the surface of the Earth. Greenhouse gases in the atmosphere absorb and re-emit back to Earth and into space.
234 Patterns Physics Electricity, Magnetism, & Power Production
System
235 Patterns Physics Electricity, Magnetism, & Power Production
System
System
Energy into the Earth system increased Less energy left the Earth system
236 Patterns Physics Electricity, Magnetism, & Power Production
System
Energy leaving the Earth system increased Less energy enters the Earth system
System
237 Patterns Physics Electricity, Magnetism, & Power Production
238 Patterns Physics Electricity, Magnetism, & Power Production
239 Patterns Physics Electricity, Magnetism, & Power Production
Earth at Equilibrium. What would change due to the factor?
240 Patterns Physics Electricity, Magnetism, & Power Production
With more greenhouse gases in the atmosphere more energy is absorbed and re-emit back to Earth. More energy is stored in the Earth.
241 Patterns Physics Electricity, Magnetism, & Power Production
242 Patterns Physics Electricity, Magnetism, & Power Production
When it comes to regulating global climate, the circulation of the Atlantic Ocean plays a key role. The constantly moving system of deep-water circulation, sometimes referred to as the Global Ocean Conveyor Belt, sends warm, salty Gulf Stream water to the North Atlantic where it releases heat to the atmosphere and warms Western Europe. The cooler water then sinks to great depths and travels all the way to Antarctica and eventually circulates back up to the Gulf Stream. Credit: Intergovernmental Panel on Climate Change Read more at: https://phys.org/news/2018-04-atlantic-ocean-circulation-weakest-years.html#jCp
243 Patterns Physics Electricity, Magnetism, & Power Production
With less greenhouse gases in the atmosphere less energy is absorbed and re-emit back to Earth. Less energy is stored in the Earth.
244 Patterns Physics Electricity, Magnetism, & Power Production
Earth at Equilibrium. What would change due to the factor?
245 Patterns Physics Electricity, Magnetism, & Power Production
Early after volcanic activity more light is reflected by ash in the atmosphere. Less energy is stored in the Earth.
246 Patterns Physics Electricity, Magnetism, & Power Production
Later, with more greenhouse gases in the atmosphere more energy is absorbed and re-emit back to Earth. More energy is stored in the Earth.
247 Patterns Physics Electricity, Magnetism, & Power Production
Earth at Equilibrium. What would change due to the factor?
248 Patterns Physics Electricity, Magnetism, & Power Production
Earth at Equilibrium. What would change due to the factor?
249 Patterns Physics Electricity, Magnetism, & Power Production
With more buildings and roads, less light is reflected. Greenhouse gases increase with fewer trees to store the CO2. More energy is stored in the Earth.
250 Patterns Physics Electricity, Magnetism, & Power Production
Earth at Equilibrium. What would change due to the factor?
251 Patterns Physics Electricity, Magnetism, & Power Production
Light energy from the sun increases because we are closer to the Sun. More energy is stored in the Earth.
252 Patterns Physics Electricity, Magnetism, & Power Production
Light energy from the sun decreases because we are farther away from to the Sun. Less energy is stored in the Earth.
253 Patterns Physics Electricity, Magnetism, & Power Production
Earth at Equilibrium. What would change due to the factor?
254 Patterns Physics Electricity, Magnetism, & Power Production
255 Patterns Physics Electricity, Magnetism, & Power Production
Remember the earth’s surface varies and it is really big and spinning
Idealized, three cell atmospheric convection in a rotating Earth. "Three cell" being either three cells north or south
Figure 7.5 in The Atmosphere, 8th edition, Lutgens and Tarbuck, 8th edition, 2001.
256 Patterns Physics Electricity, Magnetism, & Power Production
Earth at Equilibrium. What would change due to the factor?
257 Patterns Physics Electricity, Magnetism, & Power Production
More light energy reflected by ice. Less energy is stored in the Earth.
258 Patterns Physics Electricity, Magnetism, & Power Production
Less light energy reflected by ice. More energy is stored in the Earth.
259 Patterns Physics Electricity, Magnetism, & Power Production
Earth at Equilibrium. What would change due to the factor?
260 Patterns Physics Electricity, Magnetism, & Power Production
With more building and roads, less light is reflected. Greenhouse gases increase with fewer trees to store the CO2. More energy is stored in the Earth.
261 Patterns Physics Electricity, Magnetism, & Power Production
Earth at Equilibrium. What would change due to the factor?
262 Patterns Physics Electricity, Magnetism, & Power Production
Light energy from the sun increases because of more energy output. More energy is stored in the Earth.
263 Patterns Physics Electricity, Magnetism, & Power Production
Light energy from the sun decreases because of less energy output. Less energy is stored in the Earth.
264 Patterns Physics Electricity, Magnetism, & Power Production
265 Patterns Physics Electricity, Magnetism, & Power Production
266 Patterns Physics Electricity, Magnetism, & Power Production
267 Patterns Physics Electricity, Magnetism, & Power Production
268 Patterns Physics Electricity, Magnetism, & Power Production
Let us move around the Triangle
269 Patterns Physics Electricity, Magnetism, & Power Production
Let us move around the Triangle
270 Patterns Physics Electricity, Magnetism, & Power Production
Let us move around the Triangle
271 Patterns Physics Electricity, Magnetism, & Power Production
272 Patterns Physics Electricity, Magnetism, & Power Production
Let us move around the Triangle
273 Patterns Physics Electricity, Magnetism, & Power Production
274 Patterns Physics Electricity, Magnetism, & Power Production
275 Patterns Physics Electricity, Magnetism, & Power Production
Let us move around the Triangle
276 Patterns Physics Electricity, Magnetism, & Power Production
Last One
277 Patterns Physics Electricity, Magnetism, & Power Production
https://www.esrl.noaa.gov/gmd/ccgg/trends/ff .html
278 Patterns Physics Electricity, Magnetism, & Power Production
279 Patterns Physics Electricity, Magnetism, & Power Production
280 Patterns Physics Electricity, Magnetism, & Power Production
281 Patterns Physics Electricity, Magnetism, & Power Production
282 Patterns Physics Electricity, Magnetism, & Power Production
283 Patterns Physics Electricity, Magnetism, & Power Production
284 Patterns Physics Electricity, Magnetism, & Power Production
285 Patterns Physics Electricity, Magnetism, & Power Production
286 Patterns Physics Electricity, Magnetism, & Power Production
287 Patterns Physics Electricity, Magnetism, & Power Production
288 Patterns Physics Electricity, Magnetism, & Power Production
289 Patterns Physics Electricity, Magnetism, & Power Production
(Look at your 6CER - Section 1 - Exploring Our Engineering Challenge)
We as the Energy Plan Commission seek to create a 50 Year Energy Plan that must address the energy needs of Oregonians for the State of Oregon.
290 Patterns Physics Electricity, Magnetism, & Power Production
291 Patterns Physics Electricity, Magnetism, & Power Production
292 Patterns Physics Electricity, Magnetism, & Power Production
293 Patterns Physics Electricity, Magnetism, & Power Production
294 Patterns Physics Electricity, Magnetism, & Power Production
295 Patterns Physics Electricity, Magnetism, & Power Production
296 Patterns Physics Electricity, Magnetism, & Power Production
state for the next 50 years
each decade
Play with the Program for a little bit...
297 Patterns Physics Electricity, Magnetism, & Power Production
Play with the Program for a little bit...
298 Patterns Physics Electricity, Magnetism, & Power Production
299 Patterns Physics Electricity, Magnetism, & Power Production
300 Patterns Physics Electricity, Magnetism, & Power Production
301 Patterns Physics Electricity, Magnetism, & Power Production
302 Patterns Physics Electricity, Magnetism, & Power Production
In terms of our 50 year energy plan, how would you convince someone that one plan was better than the other?
303 Patterns Physics Electricity, Magnetism, & Power Production
304 Patterns Physics Electricity, Magnetism, & Power Production
305 Patterns Physics Electricity, Magnetism, & Power Production
306 Patterns Physics Electricity, Magnetism, & Power Production
307 Patterns Physics Electricity, Magnetism, & Power Production
308 Patterns Physics Electricity, Magnetism, & Power Production
309 Patterns Physics Electricity, Magnetism, & Power Production
310 Patterns Physics Electricity, Magnetism, & Power Production