
SLIDE 1
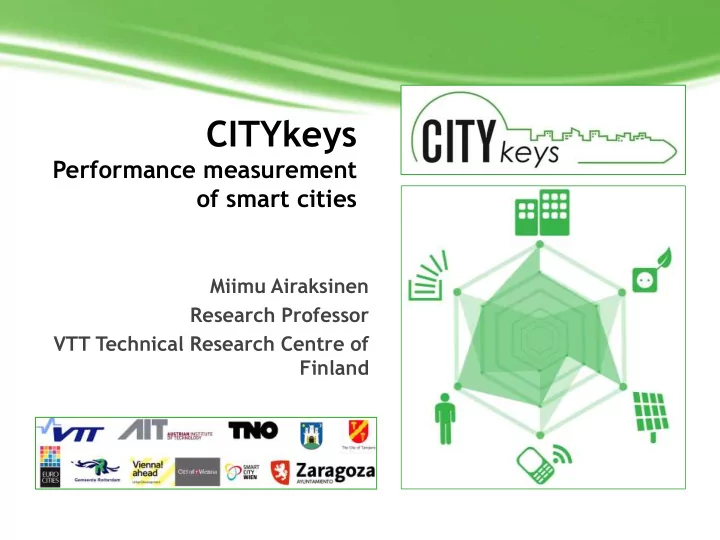
CITYkeys
Performance measurement
- f smart cities
CITYkeys Performance measurement of smart cities Miimu Airaksinen - - PowerPoint PPT Presentation
CITYkeys Performance measurement of smart cities Miimu Airaksinen Research Professor VTT Technical Research Centre of Finland The goal of CITYKEYS is to provide a validated, holistic performance measurement framework for monitoring and
CITYkeys – 646440
CITYkeys – 646440
CITYkeys – 646440
CITYkeys – 646440
CITYkeys – 646440
CITYkeys – 646440
CITYkeys – 646440
CITYkeys – 646440
CITYkeys – 646440
CITYkeys – 646440
CITYkeys – 646440
CITYkeys – 646440
CITYkeys – 646440
CITYkeys – 646440
People - Quality of life Health (eg heat stress; noise; air quality; sanitation, access to health services) Safety Access to services/resources/amenities/networks Culture and leisure (later included in “access to services) Education & skills (high level education; early classes of technology) Creativity (later included in “education”) Diversity & Social inclusion Quality of housing and of the built environment Planet - Resource efficiency Energy and mitigation (performance, savings, efficiency, renewable energy, CO2/GHG emission / savings) Climate resilience Resources Water (later included in “resources”) Environment (later rephrased as “Pollution and Waste”) Ecosystems
Red is (also) recognized as important and/or necessary by at least 50% of the cities participating in the survey Green is (also) considered priority by citizens
CITYkeys – 646440
Prosperity Economic Performance / GDP Equity Employment City attractiveness Innovation Process Policy & Organisation (later rephrased as “Organisation”) Community engagement Citizen participation (later rephrased as “Co-creation”) Multilevel governance Propagation (only at project level) Scalability Replicability
Red is (also) recognized as important and/or necessary by at least 50% of the cities participating in the survey Green is (also) considered priority by citizens
CITYkeys – 646440
CITYkeys – 646440
CITYkeys – 646440
CITYkeys – 646440
There are in principle indicators available for each of
Best covered are People, Planet and Prosperity Gaps:
Project level Education, Employment, Scalability,
City level: Multilevel governance
CITYkeys – 646440
CITYkeys – 646440
CITYkeys – 646440
CITYkeys – 646440
Indicator title Indicator unit Definition Source Type of indicator
Reduction in annual final energy consumption by buildings % reduction Change in annual final energy consumption of buildings (kWh/m2/yr) for all forms of energy (heat and water heating, cooling, lighting, cooking, ventilation and other ancillary services, electrical appliances) due to the project. Eurbanlab; Concerto; CIVIS, DGNB impact Reduction in annual final energy consumption by transport % reduction Change in annual final energy consumption of transport of all types (GJ/year) due to the project. 2 Decide impact
CITYkeys – 646440
Indicator title Indicator unit Definition Source
Annual final energy consumption of buildings MWh/cap/yr Final energy consumption of buildings for all forms of energy (heat and water heating, cooling, lighting, cooking, ventilation and other ancillary services, electrical appliances) per city capita annually. Eurbanlab; Transform Final energy use for transport GJ/cap/yr Annual final energy consumption of transport of all types (GJ/year) Eurbanlab Final energy consumption by street lighting kWh/cap/yr Annual final energy consumption of street lighting (kWh/cap/yr) in city per capita. Final energy consumption by ICT MWh/cap/yr Annual final energy consumption of IT
Green Digital Charter Final energy consumption by public buildings kWh/m2/year Change in annual final energy consumption of public buildings (kWh/cap/year) for all usages (heat and water heating, cooling, lighting, cooking, ventilation and other ancillary services, electrical appliances) due to the project City Protocol; ISO 37120; Covenant of mayors
CITYkeys – 646440
Description of the indicator Name
the indicator Reduction in annual final energy consumption by buildings Definition Change in annual final energy consumption of buildings (kWh/m2/yr) for all forms of energy (heat and water heating, cooling, lighting, cooking, ventilation and other ancillary services, electrical appliances) due to the project. Description incl. justification Energy use in buildings accounts for 40% of all sectors’ total energy consumption. To achieve the EU’s climate and energy objectives by 2020, 20% energy saving is
buildings is the main legislative instrument on EU level to improve energy performance in buildings. The directive states minimum requirements with regards to energy performance when constructing new facilities or major renovation of existing buildings. Annual energy consumption of buildings considers all energy consumed within the building. This means heat
CITYkeys – 646440
Description of the indicator Name of the indicator Improved access to basic health care services Description incl. justification Increased accessibility to basic health care will have social and economic benefits. Because… Definition The extent to which the project has increased accessibility to basic health care; e.g. with regards to physical distance (<500m), 24hrs availability, e-health services, overcoming literacy and language barriers. Normalisation (suggestion if available) Likert scale: No improvement – 1 — 2 — 3 — 4 — 5 — Very high improvement. 1. Not at all: the access to basic health care services was not improved. 2. Poor: there was little improvement in the accessibility of basic health care services. 3. Somewhat: access to basic health care services was improved, including a few important amenities such as a
CITYkeys – 646440
CITYkeys – 646440
reliable real-time monitoring on smart city performance holistic key performance indicators framework and a city index The implementation of a common performance measurement
enables stakeholders to learn from each other, create trust in solutions
CITYkeys – 646440
Sources: VTT Pro-IoT spearhead program. http://www.vtt.fi/research/spearhead_iot.jsp. VTT Ingrid Innovation program. http://www.vtt.fi/research/innovation_ingrid.jsp.
CITYkeys – 646440
The project focuses on developing and validating,
The key results are:
Key performance indicators for smart city projects Performance measurement framework, Data sets &
Policy making recommendations Business models & opportunities Smart city index recommendations
CITYkeys – 646440
Supported by