
SLIDE 1
City of Hilshire Village Texas
Counsel Meeting September 20, 2016
1
Title
Value Axis
0.00 0.05 0.10 0.15 0.20 0.25 0.30 0.35 0.40 0.45 0.50 0.55 0.60 0.65 2 1 2 1 1 2 1 2 2 1 3 2 1 4 2 1 5 2 1 6 2 1 6
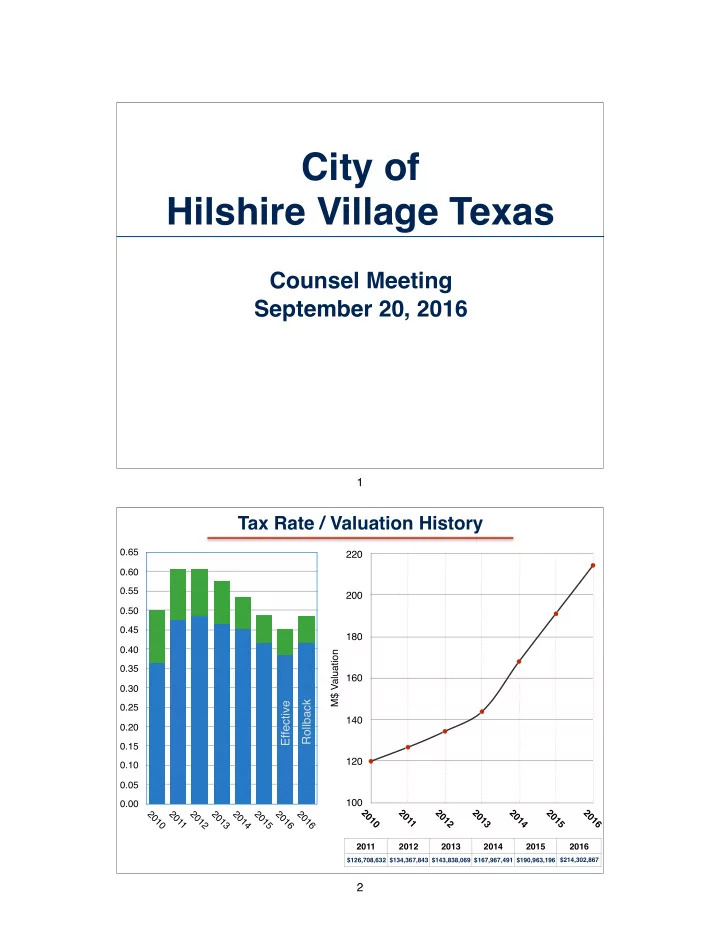
Tax Rate / Valuation History
2011 2012 2013 2014 2015 2016
$126,708,632 $134,367,843 $143,838,069 $167,967,491 $190,963,196 $214,302,867
M$ Valuation 100 120 140 160 180 200 220 2 1 2 1 1 2 1 2 2 1 3 2 1 4 2 1 5 2 1 6
Effective Rollback 2