
SLIDE 1
1990 2001
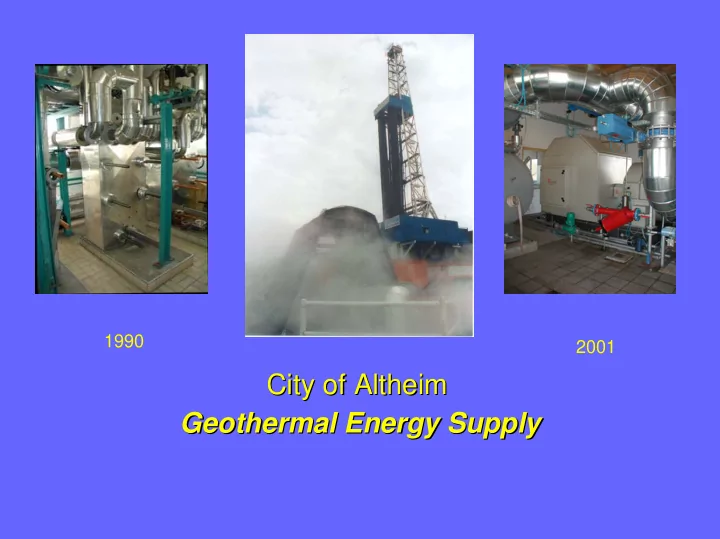
City of Altheim City of Altheim Geothermal Energy Supply - - PowerPoint PPT Presentation
1990 2001 City of Altheim City of Altheim Geothermal Energy Supply Geothermal Energy Supply Location Altheim Bayerisches Landesamt fr Wasserwirtschaft Geological section Reinjection well 2.165 m TVD 3.078 m MD 1.700 m
1990 2001
Bayerisches Landesamt für Wasserwirtschaft
Reinjection well
Geological section
Geotec Consult, Markt Schwaben, Germany
Production well
Data sheet ORC / nominal conditions (final design)
Thermal water inlet temperature 106 °C Thermal water outlet temperature 70 °C Thermal water flow rate 81,7 kg/s Thermal capacity 12.400 kW Cooling water flow rate 340 kg/s Cooling water inlet temperature (mean) 10 °C Cooling water out let temperature 18 °C Electric net output 1.000 kW
MWh heat supplied in 2005
4.134 4.069 3.402 1.994 1.250 816 754 800 1.065 1.647 3.278 4.160
January February March April May June July August September October November December
Sum of the daily differences between the mean room temperature of 20 ° C and the mean outdoor temperature for days
3.526 3.793 3.945 3.775 3.957 3.402 3.541 3.460 3.910 3.486 3.550 3.206 3.441 3.961 3.584 3.403 3.313 3.128 3.584 3.297 3.536 3.325 3.560
1983 1984 1985 1986 1987 1988 1989 1990 1991 1992 1993 1994 1995 1996 1997 1998 1999 2000 2001 2002 2003 2004 2005 Jahr
ORC power plant - annual supply to the public grid
60.808 388.374 2.020.742 1.819.408 1.005.904 916.468 1.101.132 100.000 200.000 300.000 400.000 500.000 600.000 700.000 800.000 900.000 1.000.000 1.100.000 1.200.000 1.300.000 1.400.000 1.500.000 1.600.000 1.700.000 1.800.000 1.900.000 2.000.000 2.100.000 2.200.000 2000 2001 2002 2003 2004 2005 2006 Year kWh
Supply to the grid - monthly
10.000 20.000 30.000 40.000 50.000 60.000 70.000 80.000 90.000 100.000 110.000 120.000 130.000 140.000 150.000 160.000 170.000 180.000 190.000 200.000 210.000 220.000 230.000 240.000 250.000 260.000 270.000 280.000 kWh 2001 2002 2003 2004 2005 2006 2001 40.907 132.694 115.103 99.670 2002 167.222 222.320 226.252 216.610 212.952 189.124 143.334 87.358 171.294 125.130 121.716 137.430 2003 117.832 124.496 170.568 194.786 259.966 159.576 171.380 97.876 158.330 166.470 128.814 69.314 2004 131.002 122.830 140.150 147.294 105.576 83.598 42.214 26.964 94.982 30.752 35.284 45.258 2005 98.540 12.476 124.408 181.318 200.472 150.278 148.976 2006 67.330 112.534 108.090 160.476 163.886 153.066 110.060 158.714 66.976 January February March April May June July August September October November December
2003 hours Out of operation – main reasons
January 178,75 Frost – no cooling water February 172,00 Frost – no cooling water March 6,50 Others April 80,50 Maintenance condenser May 37,50 Maintenance cooling water plant June 31,00 Turbine – noise improvement July 22,00 Lightning strike August 281,25 Cooling water – temperature too high September 25,50 Turbine – noise improvement October 36,50 Leakage head reinjection well November 1,50 Others December 323,00 Submersible pump – damage on cable (about 200 hours); air in the condenser, cleaning condenser pipes 1.196,00 Out of operation 7.564,00 On the grid
2004
Out of operation - main reasons
hours January 62,25 Dirty cooling water February 116,50 Dirty cooling water March 278,75 Leakage working fluid cycle April 50,00 Dirty cooling water May 31,00 Controlling problems 163,00 Dirty cooling water, annual maintenance June 49,25 Pumping test – ordered by the water authority July 429,25 Pumping test – ordered by the water authority August 321,75 Pumping test – ordered by the water authority 130,00 Pumping test – ordered by the water authority September 44,00 Condenser cleaning October 582,75 Leakage working fluid cycle November 386,00 Leakage working fluid cycle December 124,00 Air in the working fluid cycle after topping of fluid, dirty feed pump filter 2.768,50 Out of operation 930,25 Part caused by the pumping test 5.991,50 On the grid
2005 Out of operation - main reasons
hours January 42,50 Cooling water problems (frost, dirt) February 89,75 Cooling water problems, leakage evaporator March 744,00 Lack of working fluid - supplier stopped the production April 720,00 Lack of working fluid - supplier stopped the production May 744,00 Lack of working fluid - supplier stopped the production June 720,00 Lack of working fluid - supplier stopped the production July 744,00 Lack of working fluid - supplier stopped the production August 297,00 Lack of working fluid - supplier stopped the production; from mid of August new working fluid September 13,25 Cleaning work cooling water filters October 11,25 No cooling water November 16,25 Maintenance feed pump December 5,25 Maintenance feed pump 4.147,25 Out of operation 4.612,75 On the grid
2006 Out of operation - main reasons
hours January 377,25 No cooling water - frost February 215,75 No cooling water - frost March 258,00 No cooling water - high water/ cooling water very dirty - April 26,00 No cooling water - high water/cooling water very dirty - May 8,25 Cleaning cooling water filter June 91,00 Cooling water very dirty after torrents of rain; lightning strike July 152,00 Lightning strike, cooling water very dirty; cooling water to warm August 53,25 Cooling water very dirty September (status 13.) 0,25 Pressure test production well Out of operation per 9/13 1.181,75
6.144,00 On the grid per 9/13 4.962,25
Submersible pump: Consumption / frequency / lit. per second
30 35 40 42 43 44 46 47 48 49 95 120 172 207 210 232 268 287 315 323 60 65 75 80 85 87 90 92 96 103 25 50 75 100 125 150 175 200 225 250 275 300 325 350 375 400 1 2 3 4 5 6 7 8 9 10 Pump consumption Hertz kW Lit./sec.
Supply to the grid
561 555 570 650 95 120 170 323 50 100 150 200 250 300 350 400 450 500 550 600 650 700 750 800 12:00 08:00 16:00 06:00 12.01.2001 13.01.2001 14.01.2001 15.01.2001 kW Generator Sub.pump Grid
ORC-turbogenerator 13.9.2006
Reinjection well 13.9.2006
Date Time l/s thermal water Cooling water inlet temp. DtAnt Generator kW el kW th Efficiency
26.04.01 59 9,5 6,0 717 12.128 5,91% highest 19.11.01 16:50 27 7,8 5,5 312 7.042 4,43% 03.12.01 19:45 25 6,0 1,6 323 7.243 4,46% 15.01.02 12:24 43 3,3 2,3 560 10.154 5,52% 16.10.02 7:54 60 13,4 7,5 471 9.722 4,84% 09.02.03 11:09 42 3,0 10,9 565 10.023 5,64% 02.05.03 20:36 61 16,8 3,6 601 10.675 5,63% 01.08.03 7:12 64 18,4 6,9 513 10.209 5,02% 13.03.04 11:02 30 5,9 5,1 450 7.875 5,71% 03.08.04 7:36 65 16,0 15,3 357 9.633 3,71% lowest 21.01.05 9:16 43 3,6 6,6 384 10.352 3,71% 27.01.05 14:00 36 0,6 5,8 366 8.983 4,07% Aug.05 14.10.05 7:24 40 9,1 5,8 489 8.106 6,03% new 30.11.05 7:12 36 2,8 6,3 487 7.506 6,49% working fluid 02.12.05 7:12 28 0,7 5,8 444 6.635 6,69% 11.01.06 8:31 29 0,0 7,5 460 6.739 6,83% 20.01.06 17:53 35 1,7 6,2 540 7.327 7,37% 23.01.06 21:50 30 0,1 5,4 530 7.134 7,43% highest 23.01.06 8:01 29 0,3 5,2 469 6.921 6,78% 08.02.06 20:31 30 1,8 5,5 510 7.172 7,11% 11.02.06 11:17 41 1,2 6,6 620 8.428 7,36% 12.02.06 16:54 41 1,8 6,3 577 8.566 6,74%
Monthly 15-minute-well head pressure production well
0,00 0,25 0,50 0,75 1,00 1,25 1,50 1,75 2,00 2,25 2,50 2,75 3,00 3,25 3,50 3,75 4,00 4,25 4,50 4,75 5,00 5,25 M a i . 1 J u l . 1 S e p . 1 N
. 1 M a i . 2 J u l . 2 S e p . 2 N
. 2 M a i . 3 J u l . 3 S e p . 3 N
. 3 M a i . 4 J u l . 4 S e p . 4 N
. 4 M a i . 5 J u l . 5 S e p . 5 N
. 5 bar
Monthly 15-minute-well head pressure reinjection well
0,00 0,13 0,25 0,38 0,50 0,63 0,75 0,88 1,00 1,13 1,25 1,38 1,50 1,63 1,75 1,88 2,00 2,13 2,25 2,38 2,50 2,63 2,75 2,88 3,00 3,13 3,25 3,38 Jän. 01 Mär. 01
Jän. 02 Mär. 02
Jän. 03 Mär. 03
Jän. 04 Mär. 04
Jän. 05 Mär. 05
Current electricity price per kWh (1.10.2005 - 30.9.2006)
Price depends on the Future Market of the European Energy Exchange, Frankfurt.
Electricity price - trend
6,34 7,58 9,74 10,48 5,28 6,34 7,60 9,12 0,00 0,50 1,00 1,50 2,00 2,50 3,00 3,50 4,00 4,50 5,00 5,50 6,00 6,50 7,00 7,50 8,00 8,50 9,00 9,50 10,00 10,50 11,00 11,50 2002/2003 2003/2004 2004/2005 2005/2006 Cent per kWh Winter Summer