CITY CAPITAL SA PROPERTY HOLDINGS LTD 123.7 51.9 71.8 Values at - - PDF document

city capital sa property holdings ltd 123 7 51 9 71 8
SMART_READER_LITE
LIVE PREVIEW

CITY CAPITAL SA PROPERTY HOLDINGS LTD 123.7 51.9 71.8 Values at - - PDF document

CITY CAPITAL SA PROPERTY HOLDINGS LTD 123.7 51.9 71.8 Values at 30 November 2016 Cents/ Cents/ Gain NET ASSET VALUATION AT: 30 NOVEMBER 2016 R R R share share since 30/11/2016 31/12/2009 31/12/2009 Number of shares in issue at 30


slide-1
SLIDE 1

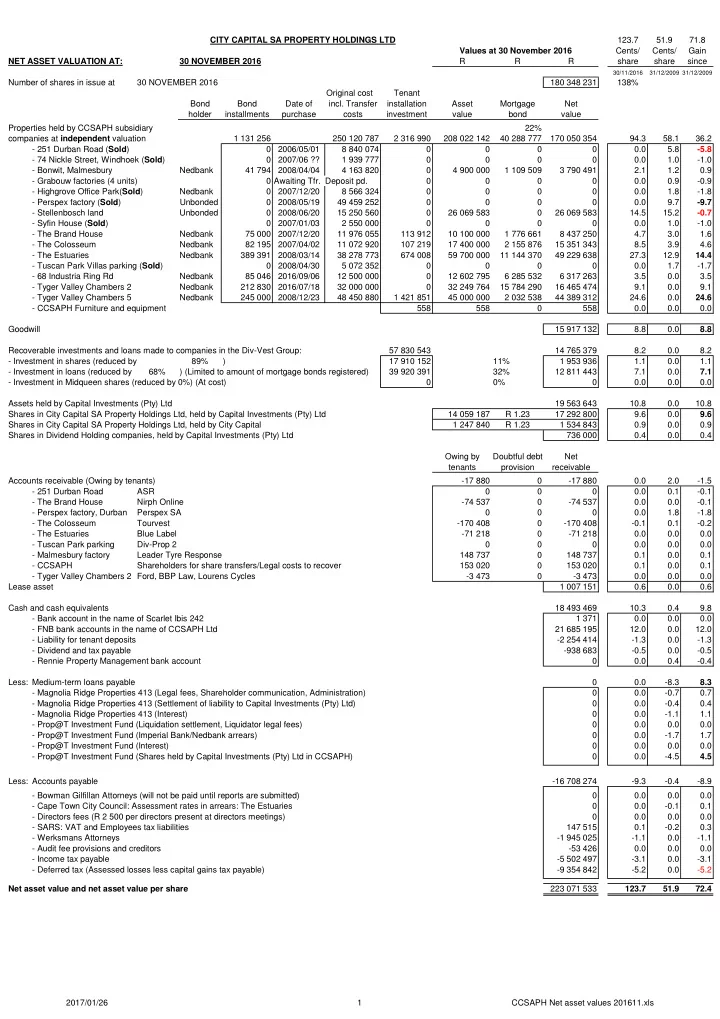
123.7 51.9 71.8 Cents/ Cents/ Gain NET ASSET VALUATION AT: 30 NOVEMBER 2016 R R R share share since

30/11/2016 31/12/2009 31/12/2009

Number of shares in issue at 30 NOVEMBER 2016 180 348 231 138% Original cost Tenant Bond Bond Date of

  • incl. Transfer

installation Asset Mortgage Net holder installments purchase costs investment value bond value 22% 1 131 256 250 120 787 2 316 990 208 022 142 40 288 777 170 050 354 94.3 58.1 36.2

  • 251 Durban Road (Sold)

2006/05/01 8 840 074 0.0 5.8

  • 5.8
  • 74 Nickle Street, Windhoek (Sold)

2007/06 ?? 1 939 777 0.0 1.0

  • 1.0
  • Bonwit, Malmesbury

Nedbank 41 794 2008/04/04 4 163 820 4 900 000 1 109 509 3 790 491 2.1 1.2 0.9

  • Grabouw factories (4 units)

0 Awaiting Tfr. Deposit pd. 0.0 0.9

  • 0.9
  • Highgrove Office Park(Sold)

Nedbank 2007/12/20 8 566 324 0.0 1.8

  • 1.8
  • Perspex factory (Sold)

Unbonded 2008/05/19 49 459 252 0.0 9.7

  • 9.7
  • Stellenbosch land

Unbonded 2008/06/20 15 250 560 26 069 583 26 069 583 14.5 15.2

  • 0.7
  • Syfin House (Sold)

2007/01/03 2 550 000 0.0 1.0

  • 1.0
  • The Brand House

Nedbank 75 000 2007/12/20 11 976 055 113 912 10 100 000 1 776 661 8 437 250 4.7 3.0 1.6

  • The Colosseum

Nedbank 82 195 2007/04/02 11 072 920 107 219 17 400 000 2 155 876 15 351 343 8.5 3.9 4.6

  • The Estuaries

Nedbank 389 391 2008/03/14 38 278 773 674 008 59 700 000 11 144 370 49 229 638 27.3 12.9 14.4

  • Tuscan Park Villas parking (Sold)

2008/04/30 5 072 352 0.0 1.7

  • 1.7
  • 68 Industria Ring Rd

Nedbank 85 046 2016/09/06 12 500 000 12 602 795 6 285 532 6 317 263 3.5 0.0 3.5

  • Tyger Valley Chambers 2

Nedbank 212 830 2016/07/18 32 000 000 32 249 764 15 784 290 16 465 474 9.1 0.0 9.1

  • Tyger Valley Chambers 5

Nedbank 245 000 2008/12/23 48 450 880 1 421 851 45 000 000 2 032 538 44 389 312 24.6 0.0 24.6

  • CCSAPH Furniture and equipment

558 558 558 0.0 0.0 0.0 Goodwill 15 917 132 8.8 0.0 8.8 Recoverable investments and loans made to companies in the Div-Vest Group: 57 830 543 14 765 379 8.2 0.0 8.2

  • Investment in shares (reduced by

89% ) 17 910 152 11% 1 953 936 1.1 0.0 1.1

  • Investment in loans (reduced by

68% ) (Limited to amount of mortgage bonds registered) 39 920 391 32% 12 811 443 7.1 0.0 7.1

  • Investment in Midqueen shares (reduced by 0%) (At cost)

0% 0.0 0.0 0.0 Assets held by Capital Investments (Pty) Ltd 19 563 643 10.8 0.0 10.8 Shares in City Capital SA Property Holdings Ltd, held by Capital Investments (Pty) Ltd 14 059 187 R 1.23 17 292 800 9.6 0.0 9.6 Shares in City Capital SA Property Holdings Ltd, held by City Capital 1 247 840 R 1.23 1 534 843 0.9 0.0 0.9 Shares in Dividend Holding companies, held by Capital Investments (Pty) Ltd 736 000 0.4 0.0 0.4 Owing by Doubtful debt Net tenants provision receivable Accounts receivable (Owing by tenants)

  • 17 880
  • 17 880

0.0 2.0

  • 1.5
  • 251 Durban Road

ASR 0.0 0.1

  • 0.1
  • The Brand House

Nirph Online

  • 74 537
  • 74 537

0.0 0.0

  • 0.1
  • Perspex factory, Durban

Perspex SA 0.0 1.8

  • 1.8
  • The Colosseum

Tourvest

  • 170 408
  • 170 408
  • 0.1

0.1

  • 0.2
  • The Estuaries

Blue Label

  • 71 218
  • 71 218

0.0 0.0 0.0

  • Tuscan Park parking

Div-Prop 2 0.0 0.0 0.0

  • Malmesbury factory

Leader Tyre Response 148 737 148 737 0.1 0.0 0.1

  • CCSAPH

Shareholders for share transfers/Legal costs to recover 153 020 153 020 0.1 0.0 0.1

  • Tyger Valley Chambers 2 Ford, BBP Law, Lourens Cycles
  • 3 473
  • 3 473

0.0 0.0 0.0 Lease asset 1 007 151 0.6 0.0 0.6 Cash and cash equivalents 18 493 469 10.3 0.4 9.8

  • Bank account in the name of Scarlet Ibis 242

1 371 0.0 0.0 0.0

  • FNB bank accounts in the name of CCSAPH Ltd

21 685 195 12.0 0.0 12.0

  • Liability for tenant deposits
  • 2 254 414
  • 1.3

0.0

  • 1.3
  • Dividend and tax payable
  • 938 683
  • 0.5

0.0

  • 0.5
  • Rennie Property Management bank account

0.0 0.4

  • 0.4

Less: Medium-term loans payable 0.0

  • 8.3

8.3

  • Magnolia Ridge Properties 413 (Legal fees, Shareholder communication, Administration)

0.0

  • 0.7

0.7

  • Magnolia Ridge Properties 413 (Settlement of liability to Capital Investments (Pty) Ltd)

0.0

  • 0.4

0.4

  • Magnolia Ridge Properties 413 (Interest)

0.0

  • 1.1

1.1

  • Prop@T Investment Fund (Liquidation settlement, Liquidator legal fees)

0.0 0.0 0.0

  • Prop@T Investment Fund (Imperial Bank/Nedbank arrears)

0.0

  • 1.7

1.7

  • Prop@T Investment Fund (Interest)

0.0 0.0 0.0

  • Prop@T Investment Fund (Shares held by Capital Investments (Pty) Ltd in CCSAPH)

0.0

  • 4.5

4.5 Less: Accounts payable

  • 16 708 274
  • 9.3
  • 0.4
  • 8.9
  • Bowman Gilfillan Attorneys (will not be paid until reports are submitted)

0.0 0.0 0.0

  • Cape Town City Council: Assessment rates in arrears: The Estuaries

0.0

  • 0.1

0.1

  • Directors fees (R 2 500 per directors present at directors meetings)

0.0 0.0 0.0

  • SARS: VAT and Employees tax liabilities

147 515 0.1

  • 0.2

0.3

  • Werksmans Attorneys
  • 1 945 025
  • 1.1

0.0

  • 1.1
  • Audit fee provisions and creditors
  • 53 426

0.0 0.0 0.0

  • Income tax payable
  • 5 502 497
  • 3.1

0.0

  • 3.1
  • Deferred tax (Assessed losses less capital gains tax payable)
  • 9 354 842
  • 5.2

0.0

  • 5.2

Net asset value and net asset value per share 223 071 533 123.7 51.9 72.4 CITY CAPITAL SA PROPERTY HOLDINGS LTD Values at 30 November 2016 Properties held by CCSAPH subsidiary companies at independent valuation 2017/01/26 1 CCSAPH Net asset values 201611.xls

slide-2
SLIDE 2

R 0.74 R 0.75 R 0.93 R 0.93 R 0.93 R 0.89 1.01 1.01 1.09 1.11 1.11 R 0.50 R 0.60 R 0.70 R 0.80 R 0.90 R 1.00 R 1.10 R 1.20 R 1.30 R 1.40 Management accounts Audited

slide-3
SLIDE 3

CITY CAPITAL SA PROPERTY HOLDINGS LTD 93 months ASSET VALUES AND NET INCOME FOR: 8.5% 1 Monthly Bond/ Asset No. GLA Vacant Vacancy Leased Monthly Monthly Monthly bond Net cash Current Bond- Asset Valuation Cap. Property name Company name valuation tenants m2 m2 % area (m2) Gross income Expenses Net income repayment flow bond value holder ratio Valuation difference rate Malmesbury factory Industrial Bonwit Malmesbury 4 900 000 1 2 470 0.0% 2 470 54 000 5 591 10% 48 409 41 794 6 615 1 273 771 Nedbank 26.0% 5 809 080 909 080 10.00% Brand House Commercial Rainbow Beach 211 10 100 000 5 1 048 0.0% 1 048 143 545 57 978 40% 85 567 75 000 10 567 2 079 860 Nedbank 20.6% 10 531 332 431 332 9.75% Colosseum Commercial Plasto Properties 9 17 400 000 3 987 0.0% 987 183 399 42 928 23% 140 470 82 195 58 275 2 477 522 Nedbank 14.2% 19 831 123 2 431 123 8.50% Estuaries Commercial Wellvest 26 59 700 000 12 3 457 0.0% 3 457 537 242 82 362 15% 454 880 389 391 65 489 12 614 664 Nedbank 21.1% 62 383 541 2 683 541 8.75% Stellenbosch land Development Evening Shade 26 000 000 0.0% 1 221 0%

  • 1 221
  • 1 221

0.0% 26 000 000 Tyger Chambers 5 Commercial Plasto Properties 18 45 000 000 9 3 419 0.0% 3 419 460 899 137 297 30% 323 602 245 000 78 602 3 142 393 Nedbank 7.0% 43 146 920

  • 1 853 080

9.00% Tyger Chambers 2 Commercial Plasto Properties 18 32 000 000 9 2 651 1 110 41.9% 1 541 220 556 83 877 38% 136 679 212 830

  • 76 151

16 000 000 Nedbank 50.0% 38 980 849 6 980 849 9.00% Parow Industria Industrial Plasto Properties 18 12 500 000 8 4 977 0.0% 4 977 129 600 12 111 9% 117 489 83 636 33 853 6 250 000 Nedbank 50.0% 14 098 680 1 598 680 10.00% City Capital portfolio 207 600 000 47 19 009 1 110 5.8% 17 899 1 729 241 423 366 24% 1 305 875 1 129 846 176 029 43 838 210 24.1% 220 781 524 13 181 524 Head office expenses 51 859

  • 51 859
  • 51 859

3.0% Total City Capital SA Property Holdings Ltd 0.0% 475 225 1 254 016 124 170 0.0% 0.0% Director actions in process: Lease out vacancies: Rate/m2 3 1 220 155 677 155 677 155 677

  • Tyger Chambers 2

115 3 1 220 155 677 155 677 155 677 Total City Capital portfolio 207 600 000 50 19 009 0.0% 19 119 1 884 918 475 225 1 409 693 1 129 846 279 847 43 838 210 24.1% 25% Director attention is presently focused on the following:

  • 1. Collect all loans owing to City Capital by Div-Vest syndication companies (approximately R 40 million in total) and invest in property.
  • 2. Control expenses such as cleaning, electricity, maintenance, property rates and security, wherever possible.

The above actions require time to finalise. Funds have been utilised to install tenant requirements at Tyger Valley Chambers and the premises have been fully leased. JANUARY 2017 2017/01/26 1 Building summary 201701.xls

slide-4
SLIDE 4

JANUARY 2017 2017/01/01 Remain. Lease Lease % Esc. lease Leased Basement Open Rental Rental: Basement Basement Open Open

  • Op. cost

Gross Property Net income Property name Tenant name start expiry

  • Esc. month

(years) area (m2) bays bays rate Premises rate parking rate parking recovery income expenses Net income by building Malmesbury factory Tyre Corporation 1 2015/11/01 2020/10/31 8.0% Nov. 3.8 2 470 21.86 54 000 0.00 0.00 54 000 5 591 48 409 48 409 Brand House 0001 SevenC Computing 1 2016/12/01 2017/12/31 8.0% Jan. 1.0 16.6% 174 4 3 90.00 15 660 650.00 2 600 450.00 1 350 4 430 24 040 24 040 Brand House 0002 Praesumo 1 2016/01/01 2017/12/31 8.0% Jan. 1.0 10.7% 112 2 99.71 11 137 769.89 1 540 0.00 2 937 15 614 15 614 Brand House 0003 Hit the Ground Running 1 2016/08/01 2019/07/31 8.0% Aug. 2.6 18.5% 194 4 4 85.00 16 448 700.00 2 800 350.00 1 400 4 311 24 959 24 959 Brand House 0101 Gravitate Multi-Video 1 2016/03/01 2019/02/28 8.0% March 2.2 20.0% 210 6 5 98.00 20 580 650.00 3 900 400.00 2 000 4 830 31 310 31 310 Brand House 0102 SevenC Computing 1 2016/01/01 2017/12/31 8.0% Jan. 1.0 34.2% 359 5 4 91.80 32 956 632.49 3 162 474.37 1 897 9 606 47 622 57 978

  • 10 356

85 567 Colosseum 306 Tourvest 1 2013/02/01 2018/01/31 8.0% Feb. 1.1 59.3% 585 21 2 151.17 88 432 902.79 18 959 629.86 1 260 3 063 111 713 111 713 Colosseum 204A Stortech Services 1 2014/11/01 2017/01/31 9.0% Nov. 0.1 24.7% 244 9 1 150.94 36 828 965.92 8 693 538.53 539 656 46 716 46 716 Colosseum 204B Ivodent 1 2017/01/01 2019/12/31 9.0% Jan. 3.0 16.0% 158 3 0 140.00 22 120 950.00 2 850 0.00 24 970 42 928

  • 17 958

140 470 Estuaries Erf 6493 1201 Stiegelmeyer 1 2015/05/01 2018/04/30 9.0% May 1.3 13.2% 217 4 4 135.68 29 399 769.89 3 080 457.36 1 829 1 484 35 792 35 792 Estuaries Erf 6493 1202 Wilite 1 2016/08/01 2017/07/31 8.0% Aug. 0.6 9.7% 159 4 2 99.00 15 741 808.00 3 232 550.00 1 100 477 20 550 20 550 Estuaries Erf 6493 1203 Brightrock 1 2015/01/01 2017/12/31 8.0% Jan. 1.0 10.5% 172 3 3 128.30 22 045 874.80 2 624 524.88 1 575 1 127 27 371 27 371 Estuaries Erf 6493 1204 Growth Circle Investments 1 2015/06/01 2018/05/31 8.0% June 1.4 6.6% 108 1 4 124.20 13 414 810.00 810 486.00 1 944 690 16 858 16 858 Estuaries Erf 6493 1205 Analytix Marketing 1 2015/07/01 2018/06/30 8.0% July 1.5 7.6% 125 1 3 113.40 14 209 810.00 810 486.00 1 458 625 17 102 17 102 Estuaries Erf 6493 1206/07/08 Uman Technologies ZA 1 2016/10/01 2020/09/30 8.0% Oct. 3.7 35.1% 577 7 1 118.40 68 352 800.00 5 600 500.00 500 4 033 78 485 78 485 Estuaries Erf 6493 1209 Smart Spaces 1 2015/05/01 2020/04/30 8.5% May 3.3 7.9% 129 3 2 114.48 14 790 810.00 2 430 486.00 972 776 18 967 18 967 Estuaries Erf 6493 1210 B & W Loudspeakers SA 1 2014/09/01 2017/08/31 8.0% Sept. 0.7 9.5% 156 2 0 117.14 18 226 850.00 1 700 0.00 1 233 21 160 38 228

  • 17 068

198 058 Estuaries Erf 6494 1301 Blue Label Distribution 1 2014/04/01 2017/03/31 9.0% April 0.2 64.2% 1 165 22 20 152.19 177 332 891.08 19 604 534.65 10 693 2 591 210 220 210 220 Estuaries Erf 6494 1302/3 Envestpro Financial Service 1 2015/04/01 2017/03/31 8.0% April 0.2 15.7% 284 4 5 113.40 32 206 864.00 3 456 540.00 2 700 453 38 815 38 815 Estuaries Erf 6494 1309 Primedia Outdoors 1 2016/12/01 2019/11/30 8.0% Dec. 2.9 8.0% 145 4 2 115.48 16 765 800.00 3 200 550.00 1 100 501 21 566 21 566 Estuaries Erf 6494 1310 Peachtree Networks 1 2016/06/01 2018/05/31 8.0% June 1.4 12.1% 220 3 2 119.00 26 194 800.00 2 400 500.00 1 000 761 30 355 44 134

  • 13 779

256 822 Stellenbosch land Vacant 0.0 0.00 0.00 0.00 1 221

  • 1 221
  • 1 221

Tyger Chambers 5 City Capital (Gr01) 1 2015/02/01 2018/01/31 8.0% Jan. 1.1 4.3% 146 6 0 158.60 23 156 755.26 4 532 0.00 741 28 429 28 429 Tyger Chambers 5 Backbone Media (Gr02) 1 2016/06/01 2017/05/31 9.0% June 0.4 3.2% 110 5 0 119.00 13 090 800.00 4 000 0.00 17 090 17 090 Tyger Chambers 5 Switch2 Cover (Gr03) 1 2016/11/01 2017/10/31 8.0% Nov. 0.8 4.2% 142 4 0 115.00 16 330 650.00 2 600 0.00 18 930 18 930 Tyger Chambers 5 Teclogix (Gr04) 1 2014/04/01 2017/03/31 9.0% April 0.2 6.1% 209 7 95.05 19 865 730.97 5 117 0.00 282 25 264 25 264 Tyger Chambers 5 R.O.N. South Africa (0101) 1 2014/11/01 2017/04/30 8.5% Nov. 0.3 3.2% 110 4 0 111.84 12 302 824.06 3 296 0.00 108 15 706 15 706 Tyger Chambers 5 Confiance Accountants (0103) 1 2014/12/01 2019/11/30 8.0% Dec. 2.9 11.7% 400 16 97.20 38 880 702.00 11 232 0.00 415 50 527 50 527 Tyger Chambers 5 Creative Performance (0104) 1 2015/03/01 2019/02/28 8.0% March 2.2 3.8% 129 4 0 102.60 13 235 715.50 2 862 0.00 144 16 241 16 241 Tyger Chambers 5 Urban Dynamics (WC) (02) 1 2015/02/01 2018/01/31 8.0% Feb. 1.1 18.7% 639 25 97.20 62 111 702.00 17 550 0.00 671 80 331 80 331 Tyger Chambers 5 Blackbird (03, 04 & 05) 1 2016/06/01 2019/05/31 8.0% June 2.4 44.9% 1 534 47 0 109.80 168 430 850.00 39 950 0.00 208 380 137 297 71 083 323 602 Tyger Chambers 2 1A ASG Printworks 1 2013/08/01 2018/07/31 9.0% Aug. 1.6 6.4% 168 2 121.19 20 404 327.00 654 0.00 21 058 21 058 Tyger Chambers 2 1B Lourens Cycles cc 1 2014/02/01 2020/01/31 8.0% Feb. 3.1 4.5% 120 1 104.98 12 597 583.20 583 0.00 393 13 573 13 573 Tyger Chambers 2 1C Weigh Less SA 1 2017/02/01 2020/01/31 8.0% Feb. 3.1 4.1% 110 2 0.00 0.00 0.00 Tyger Chambers 2 1D Salon Rejuvenate 1 2016/11/01 2019/10/31 8.0% Nov. 2.8 2.8% 75 4 125.00 9 419 500.00 2 000 0.00 1 100 12 519 12 519 Tyger Chambers 2 2 Vacant 2012/12/01 2016/11/30 8.0% Dec.

  • 0.1 14.4%

381 0.00 0.00 0.00 Tyger Chambers 2 6-8 Totalgaz SA 1 2006/12/01 2017/11/30 4.5% Dec. 0.9 40.3% 1 067 68 2 101.81 108 642 539.77 36 705 0.00 8 109 153 456 153 456 Tyger Chambers 2 9 Vacant 2014/12/01 2016/10/22 7.0% Dec. 0.0 14.0% 371 0.00 0.00 0.00 Tyger Chambers 2 10 Vacant 2014/12/01 2016/10/22 7.0% Dec. 0.0 0.9% 25 0.00 0.00 0.00 Tyger Chambers 2 11 Vacant 2014/08/01 2016/10/22 7.0% Aug. 0.0 12.6% 333 0.00 0.00 0.00 Tyger Chambers 2 Avalon 1 2016/09/01 2016/09/30 8.0% Sept. 4 525.00 2 100 0.00 2 100 2 100 Tyger Chambers 2 Primak 1 2016/09/01 2016/09/30 8.0% Sept. 15 560.00 8 400 0.00 8 400 8 400 Tyger Chambers 2 4CIT 1 2016/08/01 2016/08/31 8.0% Aug. 14 650.00 9 100 0.00 9 100 9 100 Tyger Chambers 2 Albertyn A 1 2016/08/01 2016/08/31 8.0% Aug. 1 350.00 350 0.00 350 83 877

  • 83 527

136 679 Parow Industria Lionel's Veterinary Supplies 1 2016/09/06 2018/07/31 8.0% Aug 1.6 2 377 15 38.11 105 840 0.00 0.00 105 840 105 840 Parow Industria Lionel's Veterinary Supplies 400 0.00 0.00 0.00 Parow Industria Lionel's Veterinary Supplies 2 200 10.80 23 760 0.00 0.00 23 760 12 111 11 649 117 489 40 1.5 19 009 341 84 73.38 1 394 897 716.95 244 480 396.63 33 317 56 548 1 729 241 423 366 1 305 875 1 305 875 5.8% vacancy 1 110 m2 CITY CAPITAL SA PROPERTY HOLDINGS LTD EASE AGREEMENTS AND INCOME AND EXPENDITUR 2017/01/17 1 Building summary 201701.xls

slide-5
SLIDE 5

CITY CAPITAL SA PROPERTY HOLDINGS LTD BUILDING EXPENSES JANUARY 2017 1.5% Assessment Bathroom supplies Property Refuse Monthly Property name rates Cleaning Electricity Generator Insurance Levies management removal Security Sewerage Water expenses Bonwit-Malmesbury 3 381 1 400 810 5 591 Brand House 18 592 4 645 395 1 826 29 081 2 153 1 285 57 978 Colosseum 16 672 23 505 2 751 42 928 Estuaries Erf 6493 17 932 895 512 450 2 953 5 108 3 544 717 4 308 776 1 032 38 228 Estuaries Erf 6494 23 185 903 2 979 5 152 4 514 723 4 346 1 399 934 44 134 Stellenbosch land 1 221 1 221 Tyger Chambers 5 42 351 88 033 6 913 137 297 Tyger Chambers 2 40 183 38 956 3 308 1 430 83 877 Parow Industria 7 917 2 250 1 944 12 111 171 434 6 443 907 450 11 408 189 835 25 939 2 725 8 654 2 175 3 395 423 366 Head office costs: 51 859 Accounting fees 75 000 Administration costs 45 060 Bank charges 2 315 Electricity 2 720 Interest received

  • 145 000

Printing and stationery 2 276 Refreshments 256 Rent 32 409 Salaries 32 995 Security 353 Telephone and fax 3 475

3.0%

2017/01/17 1 Building summary 201701.xls

slide-6
SLIDE 6

CCSAPH CCSAPH Plasto 18 Property FNB FNB MM Ned Annex Transfer Transfer Cash Tenant Disburse Agent Misc Mortgage Bank chgs/ Date balances account account from to receipts receipts

  • ments

fees payments VAT bond pmts interest Movement CITY CAPITAL SA PROPERTY HOLDINGS LTD: CASH FLOW MANAGEMENT AND FORECAST Total 90 952 15 557 696 7 781 018 60 331 2 445 732

  • 814 180
  • 1 334 855
  • 39 611
  • 1 131 251

134 365

  • 679 468

01-Jan-17 90 952 15 557 696 7 781 018 02-Jan-17 90 952 15 557 696 7 781 018 0 Levies/CCT/Pinewatch Insurance/Grandstand 1/2017/Profsoft/Nashua 03-Jan-17 112 018 15 347 696 7 781 018 181 898

  • 313 430
  • 55 498
  • 1 905
  • 188 935

04-Jan-17

  • 175 860

15 347 696 7 781 018 253 256

  • 541 134
  • 287 878

05-Jan-17 458 302 14 597 696 7 781 018 229 439

  • 345 122
  • 155
  • 115 838

06-Jan-17 5 168 15 057 696 7 781 018 10 374

  • 3 507 SARS

6 867 07-Jan-17 5 168 15 057 696 7 781 018 08-Jan-17 5 168 15 057 696 7 781 018 09-Jan-17 69 556 15 057 696 7 781 018 QL723 loan 6 000 62 049

  • 3 661 Telkom

64 388 10-Jan-17 1 275 15 107 696 7 781 018

  • 18 282 CoJ
  • 18 282

11-Jan-17 611 275 14 497 696 7 781 018 12-Jan-17 22 636 14 497 696 7 781 018 18 217

  • 1 780
  • 56 604
  • 548 473 Tax CCSAPH 2015
  • 588 639

13-Jan-17 2 683 14 387 696 7 781 018

  • 512 Nolan
  • 129 441 TRA/MDC 9/2016/Share repurchase
  • 129 953

14-Jan-17 2 683 14 387 696 7 781 018 15-Jan-17 2 683 14 387 696 7 781 018 16-Jan-17 2 303 14 387 696 7 781 018 2 167

  • 2 547 PEC
  • 380

17-Jan-17 9 123 13 627 696 7 781 018 1 311

  • 89 465 CCT/PEC/Co
  • 665 026 Werksmans/Share repurchases/DGC
  • 753 180

18-Jan-17 48 789 13 647 696 7 781 018 69 520

  • 9 855 Clipper/CL Electrical/James/Ladderless/Cooper

59 665 19-Jan-17 37 862 13 687 696 7 781 018 29 073 29 073 20-Jan-17 3 597 13 717 696 7 781 018

  • 1 465 Fischer Fire
  • 2 800 Durbanville GC
  • 4 265

21-Jan-17 3 597 13 717 696 7 781 018 22-Jan-17 3 597 13 717 696 7 781 018 23-Jan-17 39 336 13 717 696 7 781 018 Weigh Less dep. 35 340 399 35 739 24-Jan-17 68 237 13 717 696 7 781 018 30 008

  • 1 106 Cooper

28 901 25-Jan-17 68 237 13 717 696 7 781 018 0 Trade Avail/Multirange 26-Jan-17 5 062 13 677 696 7 781 018

  • 46 257
  • 56 919 Carine/Lynn/Boshoff/Repurchase
  • 103 175

27-Jan-17 7 009 13 577 696 7 781 018 55 697

  • 41 296 Swartland
  • 112 453 VAT Mal1,Pl18,RB,RC,SI,W26 1612
  • 98 053

28-Jan-17 7 713 12 947 696 7 781 018

  • 2 280 HTGR

IT SI 2016

  • 382 016
  • 245 000
  • 629 296

29-Jan-17 7 713 12 947 696 7 781 018 30-Jan-17 3 278 12 837 696 7 781 018 33 281

  • 72 233 CCT PL9/TV
  • 75 483 Dart/MDC 10/2016
  • 114 435

31-Jan-17 9 780 12 874 269 7 847 104

  • 21 997 Bethela/Supe
  • 1 388 Basset/Pumi

132 545 109 161 Total 9 780 12 874 269 7 847 104 41 340 976 689

  • 619 956
  • 56 604
  • 1 657 196
  • 382 016
  • 1 131 256

130 485

  • 2 698 514

2017/01/26 1 CCSAPH Cash flow.xls

slide-7
SLIDE 7

CCSAPH CCSAPH Plasto 18 Property FNB FNB MM Ned Annex Transfer Transfer Cash Tenant Disburse Agent Misc Mortgage Bank chgs/ Date balances account account from to receipts receipts

  • ments

fees payments VAT bond pmts interest Movement CITY CAPITAL SA PROPERTY HOLDINGS LTD: CASH FLOW MANAGEMENT AND FORECAST 01-Feb-17 9 629 13 254 269 7 847 104 689 555

  • 253 954 Levies/CCT/P
  • 55 751

379 850 02-Feb-17 2 987 13 474 269 7 847 104 213 358 Insurance/Grandstand 2/2017/Profsoft/Dividend 213 358 03-Feb-17 4 699 13 494 269 7 847 104 82 315

  • 56 325 CCT
  • 2 258 Nashua
  • 2 020

21 712 04-Feb-17 7 786 12 824 269 7 847 104 219 338

  • 886 251
  • 666 912

05-Feb-17 7 786 12 824 269 7 847 104 06-Feb-17 3 814 13 204 269 7 847 104 379 471

  • 3 444 Telkom

376 027 07-Feb-17 5 684 13 374 269 7 847 104 1 040 174 399

  • 3 569 SARS

171 870 08-Feb-17 3 264 13 404 269 7 847 104 QL723 loan 6 000 21 580 0 DIS Legal fees 27 580 09-Feb-17 2 176 13 434 269 7 847 104 28 912 28 912 10-Feb-17 8 480 13 434 269 7 847 104 24 585

  • 18 282 CoJ

6 304 11-Feb-17 2 305 13 494 269 7 847 104 53 825 53 825 12-Feb-17 2 305 13 494 269 7 847 104 Oude Westhofs Div. 13-Feb-17 676 13 484 269 7 847 104 Dream World 4 15 000

  • 26 629 MDC 11/2016
  • 11 629

14-Feb-17 5 676 13 404 269 7 847 104

  • 75 000
  • 75 000

15-Feb-17 68 12 914 269 7 847 104 61 000

  • 3 773 PEC
  • 552 836 Werksmans/PEC
  • 495 608

16-Feb-17 68 12 914 269 7 847 104 Natural Echo 60 17-Feb-17 3 393 12 914 269 7 847 104 Dream World 239/246 3 325 CCT/Cooper 3 325 18-Feb-17 3 355 12 834 269 7 847 104 Div-Prop 11 & 12

  • 79 439
  • 600 PC
  • 80 039

19-Feb-17 3 355 12 834 269 7 847 104 Chestnut Hill 98 20-Feb-17 5 716 12 754 269 7 847 104 Natural Echo 55

  • 77 638 CCT Ring Rd
  • 77 638

21-Feb-17 5 716 12 754 269 7 847 104 Brandwacht div. 22-Feb-17 5 716 12 754 269 7 847 104 Coral Lagoon 23-Feb-17 5 716 12 754 269 7 847 104 Silver Tunnel 20 24-Feb-17 8 890 13 464 269 7 847 104 Div-Prop 8 loan 713 174 713 174 25-Feb-17 2 714 13 434 269 7 847 104 Div-Prop 9

  • 36 176 Carine/Lynn/Boshoff/Pumi
  • 36 176

26-Feb-17 2 714 13 434 269 7 847 104 27-Feb-17 6 745 13 314 269 7 847 104 Dream World 82

  • 115 969 CCT PL9/TVC2/Swartland
  • 115 969

28-Feb-17 9 400 13 089 849 7 907 301 West Dunes 52 35 000

  • 21 997
  • 370
  • 44 866
  • 245 000

115 664

  • 161 569

9 400 13 089 849 7 907 301 Div-Prop 10 0 Bethela/Supercare/Wasteman/KnightsbridgeVAT Pl9 1701 9 400 13 089 849 7 907 301 9 400 13 089 849 7 907 301 Total 9 400 13 089 849 7 907 301 720 214 2 001 663

  • 627 377
  • 26 629
  • 730 003
  • 44 866
  • 1 131 251

113 644 275 397 2017/01/26 2 CCSAPH Cash flow.xls

slide-8
SLIDE 8

Financial year Opening Closing ended 28 Feb. balance Advances Repayments Interest balance Repayments from Totals 37 789 949 1 488 348

  • 24 680 468

25 322 561 39 920 391 2010 37 789 949 499 455

  • 37 879

4 505 292 42 756 818 Zambezi Retail Park 2011 42 756 818

  • 1 470 000

3 779 160 45 065 978 Imperial Bank Terraces, Steenberg Terraces, Silverberg 2012 45 065 978 37 823

  • 2 038 038

3 200 227 46 265 990 Kyalami, Thabazimbi, Oewerpark, Old Dutch 3 2013 46 265 990 20 648

  • 2 567 542

3 397 033 47 116 129 Quantum House, Oewerpark, Brandwacht, Canal Edge 2 U7 2014 47 116 129 589 422

  • 2 745 595

3 145 366 48 105 322 Steenberg House, Linel, Imperial Bank Terraces 2015 48 105 322 340 000

  • 8 117 449

2 110 338 42 438 211 Tuscan Park, Edward I, Old Dutch 7, Silvermine House 2016 42 438 211 1 000

  • 4 016 800

2 930 433 41 352 845 Lipco, IBT, Silver Lakes, Tyger Lakes, Lagoon Beach, Silverberg Terraces 2017 41 352 845

  • 3 687 165

2 254 711 39 920 391 IBT 2nd floor, NPB, Tyger Lakes, IBT 1st floor CITY CAPITAL SA PROPERTY HOLDINGS LTD LOANS TO DIVIDEND SYNDICATION COMPANIES: YEARS ENDED 2010 TO 2017 2017/01/26 1 Dividend loan summary 2010-2017.xls

slide-9
SLIDE 9

Balance Balance Interest Capital Company name Building 29/2/2016 Advances Repayments Interest 30/11/2016 Provision portion portion Totals 41 352 844.66 0.00 -3 687 164.75 2 254 711.01 39 920 390.92 6 440 000.00 1 507 738.60 26 989 389.34 18 767 413.22 8 221 976.10 8 Mile Investments 122 Tuscan Park, 1st Floor 0.00 0.00 0.00 0.00 0.00 0 Settlement on file A Million Up Investments 116 Edward 1 Building 0.00 0.00 0.00 0.00 0.00 0 Consent on file A Million Up Investments 15 Lipco Building Parklands Unit 7 & 8 307 496.05 0.00 0.00 25 160.53 332 656.58 332 657 Funds in trust 229 559 103 098 A Million Up Investments 47 Canal Edge 1 Unit 9 0.00 0.00 0.00 0.00 0.00 Amber Mountain Investments 12 Imperial Bank Terraces, 5th Floor 0.00 0.00 0.00 0.00 0.00 0 AFS on file Amber Mountain Investments 21 Imperial bank Terraces, 6th Floor 0.00 0.00 0.00 0.00 0.00 Blue Cloud Investments 222 Imperial Bank Terraces 2nd Floor 686 828.68 0.00

  • 664 815.00
  • 22 013.68

0.00 Blue Cloud Investments 239 Imperial Bank Terraces, Shop 2, Ground Floor 2 727 032.21 0.00 0.00 223 136.44 2 950 168.64 500 000 2 450 169 AFS on file 1 637 630 812 539 Blue Moonlight Properties 38 Tuscan Park, Ground Floor 585 274.04 0.00 0.00 47 889.41 633 163.45 633 163 Funds in trust 633 163 Born Free Investments 58 Silverberg Terraces 0.00 0.00 0.00 0.00 0.00 Catfish Investments 29 Quantum House Techno Park Unit 5 & 6 0.00 0.00 0.00 0.00 0.00 Chestnut Hill Investments 98 Westport Square, Blouberg Sands 5 948 913.27 0.00 0.00 0.00 5 948 913.27 4 477 935 L & D account approved 1 593 274 2 884 661 C-Max Investments 263 Canal Edge 1 Unit 7 444 091.40 0.00 0.00 36 337.29 480 428.70 313 109 167 320 167 320 Coral Lagoon Investments Imperial Bank Terraces 1st Floor 2 303 592.30 0.00 0.00 188 488.93 2 492 081.22 2 492 081 Funds in trust 2 492 081 Coral Lagoon Investments 44 Steenberg House Unit 4 0.00 0.00 0.00 0.00 0.00 De Facto Investments 31 N1 City Mews Unit A11 321 712.08 0.00 0.00 26 323.74 348 035.82 230 734 117 302 117 302 Div-Prop 14 Midqueen 0.00 0.00 0.00 0.00 0.00 Div-Prop 10 Silver Lakes Capital 1 310 736.49 0.00 0.00 107 249.58 1 417 986.07 1 417 986 Funds in trust 823 963 594 024 Div-Prop 11 Zambezi Retail Park Phase 2 1 309 650.15 0.00 0.00 107 160.70 1 416 810.84 2 400 000 0 Bond on file Div-Prop 12 Zambezi Retail Park (Capital) 7 712 693.96 0.00 0.00 319 203.04 8 031 897.00 2 400 000 5 631 897 Bond on file 3 843 183 1 788 714 Div-Prop 13 Kyalami 0.00 0.00 0.00 0.00 0.00 Div-Prop 2 Tuscan Park Innofin 0.00 0.00 0.00 0.00 0.00 Div-Prop 4 Fourways NPB Building 2 790 448.80 0.00 -2 400 000.00 178 297.28 568 746.08 568 746 AFS on file 568 746 Div-Prop 5 Linel Building - CenturioN 0.00 0.00 0.00 0.00 0.00 0 AFS on file Div-Prop 6 Fish Hoek Town Square 0.00 0.00 0.00 0.00 0.00 Div-Prop 8 Tyger Lake 1 828 642.29 0.00

  • 371 316.15

149 519.84 1 606 845.98 635 615 Portions sold, co insolven 635 615 Div-Prop 9 Thabazimbi Capital 0.00 0.00 0.00 0.00 0.00 Dotcom Trading 428 Old Dutch Square Unit 7 0.00 0.00 0.00 0.00 0.00 Dream World Investments 213 Greenford Office Estate, Block B 746 994.97 0.00 0.00 61 122.05 808 117.01 808 117 436 416 371 701 Dream World Investments 225 Noland House 0.00 0.00 0.00 0.00 0.00 Dream World Investments 246 Greenford Office Estate, Block I 692 641.63 0.00 0.00 13 894.40 706 536.03 706 536 In liquidation 369 597 336 939 Dream World Investments 4 Canal Edge 1 Unit 16 500 600.64 0.00 0.00 0.00 500 600.64 500 601 Funds in trust 253 541 247 060 Dream World Investments 82 Lagoon Beach Office Park 424 906.13 0.00 0.00 34 767.48 459 673.61 459 674 Funds in trust 459 674 Duelco Investments 136 Bergstig Park Unit 7 & 8 1 314 167.13 0.00 0.00 107 530.29 1 421 697.42 300 000 483 043 638 654 Valuation on file 638 654 Eagle Creek Investments 164 Tuscan Park, 2nd Floor 283 007.48 0.00 0.00 23 156.78 306 164.26 306 164 Funds in trust 306 164 Fixtrade 248 Oewerpark Office Building Unit 15 0.00 0.00 0.00 0.00 0.00 Gypsey Queen Properties 29 Canal Edge Two, Unit 3 0.00 0.00 0.00 0.00 0.00 Initiative SA Investments 14 Oewerpark Office Building Unit 24 0.00 0.00 0.00 0.00 0.00 Initiative SA Investments 42 Sunbird Office Park unit 5 720 407.73 0.00 0.00 58 946.58 779 354.31 180 000 599 354 AFS on file 424 748 174 607 Liberty Moon Investments 35 The Ridge Office Park Unit 7A 600 071.28 0.00 0.00 49 100.18 649 171.46 100 000 549 171 352 145 197 026 Limosa Investments 120 Oewerpark Office Park Unit 4 0.00 0.00 0.00 0.00 0.00 Limosa Investments 94 Oewerpark Office Park Unit 10 0.00 0.00 0.00 0.00 0.00 Little Swift Investments 47 Silverberg Terraces, Steenberg Suite F03 0.00 0.00 0.00 0.00 0.00 Midnight Storm Investments 150 KPMG Hatfield 0.00 0.00 0.00 0.00 0.00 Midnight Storm Investments 43 Titan House Technopark 350 777.50 0.00 0.00 28 701.99 379 479.49 379 479 Funds in trust 379 479 Natural Echo Investments 52 Steenberg Terraces, 1st Floor 0.00 0.00 0.00 0.00 0.00 Natural Echo Investments 55 Silvermine House, Steenberg 1 184 019.35 0.00 0.00 96 881.09 1 280 900.44 0 AFS on file Natural Echo Investments 60 Silvermine House, Ground Floor 621 283.98 0.00 0.00 50 835.88 672 119.86 672 120 Funds in trust 561 603 110 517 New Line Investments 73 The Ridge Office Park Unit 7B 429 278.29 0.00 0.00 35 125.23 464 403.51 100 000 185 987 0 Settlement on file Oewerpark 16 Stellenbosch Oewerpark Office Park Unit 16 0.00 0.00 0.00 0.00 0.00 Ontrak Investments 159 Quantum House Techno Park Unit 3 & 4 0.00 0.00 0.00 0.00 0.00 0 Consent on file Paradise Creek Investments 98 Steenberg Ground Floor 0.00 0.00 0.00 0.00 0.00 0 Settlement on file Platinum Mile Investments 557 Oudewesthof Village Square Units 12,13 & 14 0.00 0.00 0.00 0.00 0.00 0 Settlement on file Platinum Mile Investments 623 Imperial Bank Terraces, Office 7 0.00 0.00 0.00 0.00 0.00 Mortgage bonds CITY CAPITAL SA PROPERTY HOLDINGS LTD LOANS TO DIVIDEND SYNDICATION COMPANIES: YEAR ENDED 28 FEBRUARY 2017 Provision 2017/01/26 1 Dividend loan summary 201702.xls

slide-10
SLIDE 10

Balance Balance Interest Capital Company name Building 29/2/2016 Advances Repayments Interest 30/11/2016 Provision portion portion Totals 41 352 844.66 0.00 -3 687 164.75 2 254 711.01 39 920 390.92 6 440 000.00 1 507 738.60 26 989 389.34 18 767 413.22 8 221 976.10 Mortgage bonds CITY CAPITAL SA PROPERTY HOLDINGS LTD LOANS TO DIVIDEND SYNDICATION COMPANIES: YEAR ENDED 28 FEBRUARY 2017 Provision Present Perfect Investments 298 Canal Edge Two, Unit 6 0.00 0.00 0.00 0.00 0.00 Present Perfect Investments 56 Brandwacht Park, Merlot House 0.00 0.00 0.00 0.00 0.00 Quantum Leap Investments 723 Canal Edge Two, Unit 15 371 493.67 0.00

  • 54 000.00

28 101.76 345 595.44 0 Settlement on file Razorbill Properties 308 N1 City Mews Unit A14 0.00 0.00 0.00 0.00 0.00 Scarlet Ribbon Properties 21 Quantum House Techno Park Unit 1 0.00 0.00 0.00 0.00 0.00 Silver Knight Properties 103 Canal Edge Two, Unit 7 0.00 0.00 0.00 0.00 0.00 Silver Knight Properties 61 Lipco Parklands Unit 1,3 & 4 0.00 0.00 0.00 0.00 0.00 Silver Tunnel Investments 20 Waterside Place Office Building 2 297 657.33 0.00 0.00 188 003.31 2 485 660.64 360 000 556 268 AFS on file 556 268 Southern Palace Investments 48 Silverberg Terraces, Steenberg Office Park 0.00 0.00 0.00 0.00 0.00 Sweet Equity Investments 103 Canal Edge Two, Unit 9 0.00 0.00 0.00 0.00 0.00 Sweet Equity Investments 25 Lipco Parklands Unit 2,5 & 6 284 902.69 0.00 0.00 23 311.85 308 214.54 308 215 Funds in trust 247 830 60 384 Tiger Stripes Investments 15 Quantum House Techno Park Unit 2 0.00 0.00 0.00 0.00 0.00 Trackstar Trading 30 Old Dutch Square Unit 3 0.00 0.00 0.00 0.00 0.00 0 Settlement on file Versatex Trading 36 N1 City - Unit B4 578 272.73 0.00 0.00 47 316.54 625 589.26 100 000 294 866 230 723 AFS on file 230 723 Viking Pony Properties 319 Oudewesthof Unit 15 & 16 0.00 0.00 0.00 0.00 0.00 West Dunes Properties 52 Imperial Bank Terraces, Shop 6,7,8, 1st Floor 1 675 250.43 0.00

  • 197 033.60

21 162.50 1 499 379.33 1 349 441 10% liquidation estimate 808 735 540 707 2017/01/26 2 Dividend loan summary 201702.xls

slide-11
SLIDE 11

IN THE HIGH COURT OF SOUTH AFRICA WESTERN CAPE DIVISION, CAPE TOWN Case No 16916/2016 In the matter between CITY CAPITAL SA PROPERTY HOLDINGS LIMITED Applicant and MAGISTRATE HJ LE ROUX 1st Respondent C B ST CLAIR COOPER N.O. 2nd Respondent E W PRINSLOO N.O. 3rd Respondent DAVID ISAI FERREIRA N.O. 4th Respondent SUSANNA LACEA ALETTA FERREIRA N.O. 5th Respondent CLARENCE COLLINS N.O. 6th Respondent LOMBARD & KRIEK ATTORNEYS 7th Respondent CHRIS EDELING 8th Respondent THE LIQUIDATORS OF DREAM WORLD INVESTMENTS 246 (PTY) LTD (IN LIQUIDATION) Intervening party DRAFT ORDER The parties consent to an order in the following terms: 1. The final liquidators of Dream World 246 (Pty) Ltd (in liquidation) – (hereafter referred to as “the Company”) will, in examining the claims of the DI Ferreira Familie Trust, Lombard & Kriek Attorneys, Midnight Masquerade Properties 181 (Pty) Ltd and Chris Edeling (hereinafter collectively referred to as “the proved claims”), as required by Section 45

  • f Act 24 of 1936 as amended, receive and take into consideration any

written representations which the Applicant may wish to make regarding

slide-12
SLIDE 12

2 the question of whether the said claims should be reduced or disallowed. 2. Once they have examined the proved claims as aforesaid the liquidators will notify the Applicant of their conclusions in respect of the proved claims and whether they intend to report to the Master that they dispute any of the proved claims or part thereof. If the liquidators should report to the Master that they dispute any of the proved claims, in whole or in part, they shall also notify the Applicant of any such dispute. 3. The Applicant reserves the right to challenge, by way of judicial review, any decision of the liquidators or the Master relating to the investigation and expungment of any of the proved claims, whether in whole or in

  • part. Such review application must be instituted within 14 (fourteen)

days of the Applicant being notified of any such decision. 4. Whilst any review challenge to any of the proved claims is pending, no payments will be proposed or made in respect of such proved claims that are subject to such review proceedings. 5. The liquidators will notify the Applicant of any liquidation and distribution account that may be submitted to the Master. The Applicant’s rights to challenge any such account by way of review remain reserved. No payment will be made to any proved creditors in terms of a liquidation and distribution account that is subject to a pending review. 6. If the liquidators should at any time intend to make any distribution to proved creditors before the Applicant’s disputed claim against the Company has been finally decided by way of the arbitration that has

slide-13
SLIDE 13

3 been agreed to but not yet commenced, they shall retain a sufficient amount in the estate to enable them to pay to the Applicant whatever dividends it would have been entitled to if its claim of R706 756,54 had been recognised as a proved claim. 7. The Applicant withdraws its application subject to the provisions of this

  • rder.

8. The costs of these proceedings shall be determined by the Arbitrator in the aforesaid arbitration proceedings. BY ORDER OF COURT REGISTRAR OF THE HIGH COURT

slide-14
SLIDE 14
slide-15
SLIDE 15
slide-16
SLIDE 16
slide-17
SLIDE 17
slide-18
SLIDE 18
slide-19
SLIDE 19

2017 2016 2015 2014 2013 2012 2011 2010 2009 2008 Unaudited Audited Audited Audited Audited Audited Audited Audited Audited Audited Rth Rth Rth Rth Rth Rth Rth Rth Rth Rth 9 months Statement of financial position at 28 February Assets Non-current assets Investment property 208 022 215 100 219 700 206 700 219 500 230 000 216 600 216 250 216 301 61 761 Property, plant and equipment 2 318 2 798 2 868 1 410 1 519 1 671 1 758 1 938 7 404 721 Goodwill 15 917 15 917 15 917 15 917 15 917 15 917 15 917 15 917 15 917 16 060 Investments in property syndications 1 954 1 954 2 309 2 765 5 709 6 402 8 857 13 723 16 629 37 656 Financial asset: Capital Investments 19 564 16 342 15 920 13 720 12 947 13 469 30 451 Financial asset: Dividend Inv. Loans 12 811 15 818 18 927 25 876 16 716 18 291 18 512 18 935 17 724 7 093 Deferred tax 1 012 81 Operating lease asset 659 684 2 190 1 909 1 715 2 269 2 675 2 252 1 250 206 261 245 268 613 277 831 268 297 274 023 288 018 264 319 270 027 275 225 154 029 Current assets Current tax receivable 18 4 4 58 67 17 Operating lease asset 348 348 366 241 164 350 511 673 427 59 Trade and other receivables 255 886 2 328 554 2 311 2 180 2 085 2 887 430 1 788 Cash and cash equivalents 21 687 10 854 4 402 8 473 727 886 886 1 594 11 138 52 136 22 289 12 088 7 096 9 286 3 206 3 420 3 482 5 212 12 062 54 000 Total assets 283 535 280 700 284 928 277 584 277 230 291 439 267 801 275 239 287 287 208 029 Equity and liabilities Equity Share capital 289 838 305 552 305 552 305 552 305 552 305 552 304 571 304 571 304 571 196 538 Accumulated loss

  • 66 766
  • 67 427
  • 72 819
  • 89 075 -114 046 -105 295 -144 621 -146 507
  • 133 770
  • 7 813

223 072 238 125 232 733 216 477 191 506 200 257 159 950 158 064 170 801 188 725 Liabilities Non-current liabilities Financial liabilities: Mortgage bonds 40 289 24 174 34 541 41 722 70 545 78 668 94 970 107 442 112 267 14 688 Financial liabilities: Prop-at-T/Magnolia 4 691 4 517 4 916 8 912 6 184 Deferred tax 9 355 13 459 10 021 6 722 5 650 4 317 65 604 1 835 49 644 37 633 44 562 53 135 80 712 87 901 103 947 113 626 112 871 16 523 Current liabilities Financial liabilities: Capital Investments 2 086 588 Current tax payable 5 502 607 3 707 4 072 1 270 868 334 322 241 266 Trade and other payables 5 317 4 334 3 925 3 900 3 742 2 413 3 571 3 228 692 1 340 Bank overdraft 597 587 10 819 4 942 7 633 7 972 5 012 3 281 3 905 3 550 3 616 2 781 Total liabilities 60 463 42 575 52 195 61 107 85 724 91 182 107 852 117 176 116 486 19 304 Total equity and liabilities 283 535 280 700 284 928 277 584 277 230 291 439 267 802 275 240 287 287 208 029 Current ratio 2.1 2.4 0.9 1.2 0.6 1.0 0.9 1.5 3.3 19.4 Debt : equity ratio 0.3 0.2 0.2 0.3 0.4 0.5 0.7 0.7 0.7 0.1 Debt : asset ratio 0.2 0.2 0.2 0.2 0.3 0.3 0.4 0.4 0.4 0.1 Shares in issue 180 348 214 509 214 509 214 509 214 509 214 509 212 952 212 952 212 952 196 538 Net asset value per share (cents) 124 111 108 101 89 93 75 74 80 96

CITY CAPITAL SA PROPERTY HOLDINGS LIMITED

SUMMARY OF FINANCIAL RESULTS FROM 2007 TO 2017

2017/01/26 1 CCSAPH AFS Summary 201611.xlsx

slide-20
SLIDE 20

2017 2016 2015 2014 2013 2012 2011 2010 2009 2008 Unaudited Audited Audited Audited Audited Audited Audited Audited Audited Audited Rth Rth Rth Rth Rth Rth Rth Rth Rth Rth 9 months

CITY CAPITAL SA PROPERTY HOLDINGS LIMITED

SUMMARY OF FINANCIAL RESULTS FROM 2007 TO 2017

Statement of comprehensive income Revenue 13 284 19 015 17 740 16 366 17 598 16 386 17 797 18 026 12 176 3 176 Other income 18 289 1 328 1 038 1 607 1 177 2 282 1 589 746 207 4 Operating expenses

  • 11 557
  • 14 739
  • 10 357
  • 6 282
  • 12 090

5 251

  • 10 677
  • 26 313
  • 133 977
  • 11 794

Operating profit/(loss) 20 016 5 603 8 420 11 691 6 685 23 919 8 709

  • 7 541
  • 121 594
  • 8 614

Investment revenue 3 941 3 302 2 571 4 243 3 432 3 247 4 208 5 108 6 482 2 074 Fair value adjustments

  • 15 349

3 905 13 000 17 990

  • 10 500

24 790 350

  • 51
  • 1 222

6 522 Finance costs

  • 2 187
  • 2 652
  • 3 345
  • 4 627
  • 6 598
  • 7 842
  • 10 229
  • 11 773
  • 10 219
  • 1 424

Profit/(loss) before taxation 6 421 10 158 20 646 29 297

  • 6 981

44 114 3 038

  • 14 257
  • 126 553
  • 1 442

Taxation

  • 2 365
  • 4 765
  • 4 390
  • 4 325
  • 1 770
  • 4 788
  • 1 152

1 520 596

  • 1 161

Profit/(loss) for the year 4 056 5 392 16 256 24 972

  • 8 752

39 326 1 886

  • 12 737
  • 125 957
  • 2 603

Opening accumulated loss

  • 67 427
  • 72 819
  • 89 075 -114 046 -105 295 -144 621 -146 507 -133 770
  • 7 813
  • 5 210

Dividends paid

  • 3 395

Closing accumulated loss

  • 66 766
  • 67 427
  • 72 819
  • 89 075 -114 046 -105 295 -144 621 -146 507
  • 133 770
  • 7 813

Gross margin 150.7% 29.5% 47.5% 71.4% 38.0% 146.0% 48.9%

  • 41.8%
  • 998.6%
  • 271.2%

Net profit % 48.3% 53.4% 116.4% 179.0%

  • 39.7%

269.2% 17.1%

  • 79.1% -1039.4%
  • 45.4%

Return on investment 1.4% 1.8% 5.3% 8.2%

  • 2.9%

12.9% 0.6%

  • 4.2%
  • 41.4%
  • 1.3%

Return on total assets 1.4% 1.9% 5.7% 9.0%

  • 3.2%

13.5% 0.7%

  • 4.6%
  • 43.8%
  • 1.3%

Earnings per share (cents) 2 3 8 12

  • 4

18 1

  • 6
  • 59
  • 1

Growth in EPS

  • 11%
  • 67%
  • 35%

385%

  • 122%

1970% 115% 90%

  • 4366%

93% Dividend per share (cents) 2 Growth in DPS 0% 0% 0% 0% 0% 0% 0% 0% 0% 0% Statement of cash flows Cash flows from operating activities Cash generated from/(used in) operations 5 000 12 395 5 924 8 624 11 932 10 223 12 393 5 891 1 479

  • 528

Interest income 3 626 3 286 2 571 3 982 3 432 3 247 4 207 4 867 6 474 2 074 Dividends received 315 16 261 242 Finance costs

  • 2 187
  • 2 652
  • 3 345
  • 4 627
  • 6 598
  • 7 842
  • 10 229
  • 11 773
  • 10 218
  • 1 424

Tax paid

  • 1 574
  • 4 427
  • 1 438
  • 299
  • 35
  • 4
  • 3
  • 5
  • 717
  • 49

Net cash from operating activities 5 179 8 618 3 712 7 940 8 731 5 624 6 368

  • 778
  • 2 982

73 Cash flows from investing activities Purchase of investment property

  • 44 922
  • 62
  • 156 706
  • 55 239

Purchase of property, plant & equipment

  • 225
  • 871
  • 2 229
  • 438
  • 371
  • 496
  • 253
  • 1 499
  • 6 972
  • 730

Sale of investment property 52 000 7 980 23 550 15 160 Movement in investments 52 298 3 391

  • 1 511
  • 938

4 867 2 906 4 638

  • 42 734

Movement in loans receivable 1 795 1 101 6 019

  • 898

1 513

  • 501
  • 1 944
  • 8 179
  • 86 542
  • 44 967

Sale of other assets 2 850 1 450

  • 1

Net cash from investing activities 8 648 8 201 4 088 28 455

  • 369

14 675 2 669

  • 6 772
  • 245 582 -143 670

Cash flows from financing activities Proceeds of share issues

  • 15 714

981 108 033 169 805 (Repayment)/receipt of loans 16 115

  • 10 367
  • 11 872
  • 28 649
  • 8 521
  • 21 280
  • 9 745
  • 1 397

99 523 12 868 Dividends paid

  • 3 395

Net cash from financing activities

  • 2 995
  • 10 367
  • 11 872
  • 28 649
  • 8 521
  • 20 299
  • 9 745
  • 1 397

207 556 182 673 Total cash movement for the year 10 832 6 452

  • 4 071

7 746

  • 159
  • 708
  • 8 947
  • 41 008

39 076 Cash at beginning of the year 10 854 4 402 8 473 727 886 886 1 594 10 541 51 549 12 473 Cash at end of the year 21 687 10 854 4 402 8 473 727 886 886 1 594 10 541 51 549 2017/01/26 2 CCSAPH AFS Summary 201611.xlsx

slide-21
SLIDE 21
slide-22
SLIDE 22
slide-23
SLIDE 23
slide-24
SLIDE 24

2016 2017 2017 Full year First half Second half Net profit before tax 10 157 768 4 762 329 3 286 849 Estimate Deduct: Fair value adjustments

  • 5 504 503
  • 1 534 843

Add: Fair value adjustments 1 600 000 16 883 931 Net cash profit before tax 6 253 266 21 646 260 1 752 006 Less: Normal income taxation

  • 1 327 412
  • 6 433 466
  • 623 779 Estimate

Net cash profit after income tax 4 925 854 15 212 795 1 128 227 Estimate 68% 30% 60% Dividend amount 3 349 581 4 563 838 676 936 Rounding amount 45 669

  • 11 273

44 457 Rand amount of the dividend 3 395 250 4 552 566 721 393 Number of shares in issue 199 720 561 182 102 625 180 348 231 Dividend per share (cents per share) 1.7 2.5 0.4 (minimum of 1 cent per share in terms of the policy) Dividend per 100 000 shares held 1 700 2 500 400 Less: Dividends tax 15%

  • 255
  • 375
  • 60

Net dividend payable 1 445 2 125 340 Dividend percentage approved by the Board in terms of the Dividend policy DIVIDEND REPORT AND ESTIMATE FOR THE SECOND HALF OF 2017 CITY CAPITAL SA PROPERTY HOLDINGS LTD

slide-25
SLIDE 25

March 2016 Extension Total Number of shares repurchased 30 285 750 4 572 504 34 858 254 Amount paid 13 931 445 2 103 352 16 034 797 Repurchase price (cents per share) 46 46 46 Number of shareholders 114 32 146 Number of shareholders removed from the share register 95 26 121 The amount for which shares will be repurchased cannot be increased as the company has limited cash resources at its disposal. Repurchase opportunity CITY CAPITAL SA PROPERTY HOLDINGS LTD SHARE REPURCHASE REPORT The opportunity for shareholders to offer their shares for sale to the company at 46 cents per share will remain open for those shareholders that can no longer wait for the return of their capital. Share repurchases at 46 cents per share benefit the shareholders that remain invested by accelerating the increase in the net asset value per share. The above share repurchases have increased the net asset value per share of the company by approximately 12 cents per share.

slide-26
SLIDE 26

Share options have to-date been issued to the following directors of the company: Option Number certificate Stabilisation Growth

  • f

Effective date of number Issued to

  • ptions
  • ptions

share options issue 1 MA Conradie 544 932 271 157 816 089 28 February 2015 2 JV Carstens 544 932 271 157 816 089 28 February 2015 3 AJ Herweg 544 932 271 157 816 089 28 February 2015 4 JS Boshoff 544 932 271 157 816 089 28 February 2015 5 EE Visagie 544 932 271 157 816 089 28 February 2015 2 724 658 1 355 787 4 080 444 2010 2015 2016 Net asset value per AFS 158 063 943 232 732 923 238 124 927 Number of shares in issue 214 509 460 214 509 460 Net asset value per share 108 111 Increase in net asset value 74 668 980 5 392 004 2% of the increase in NAV 1 493 380 107 840 Number of options issued 1 376 445 97 145 Number of eligible directors 5 5 Number of options issued per director 275 289 19 429 Issued To be issued CITY CAPITAL SA PROPERTY HOLDINGS LTD REPORT ON THE ISSUE OF SHARE OPTIONS TO THE DIRECTORS OF THE COMPANY The directors are not permitted to exercise the options for a period of two years from the date of issue and none have been exercised to-date. 28 February 2017/01/27 1 Share option report 201701.xlsx