
SLIDE 1
1
Chapter 5: z-Scores
12 82 x = 76
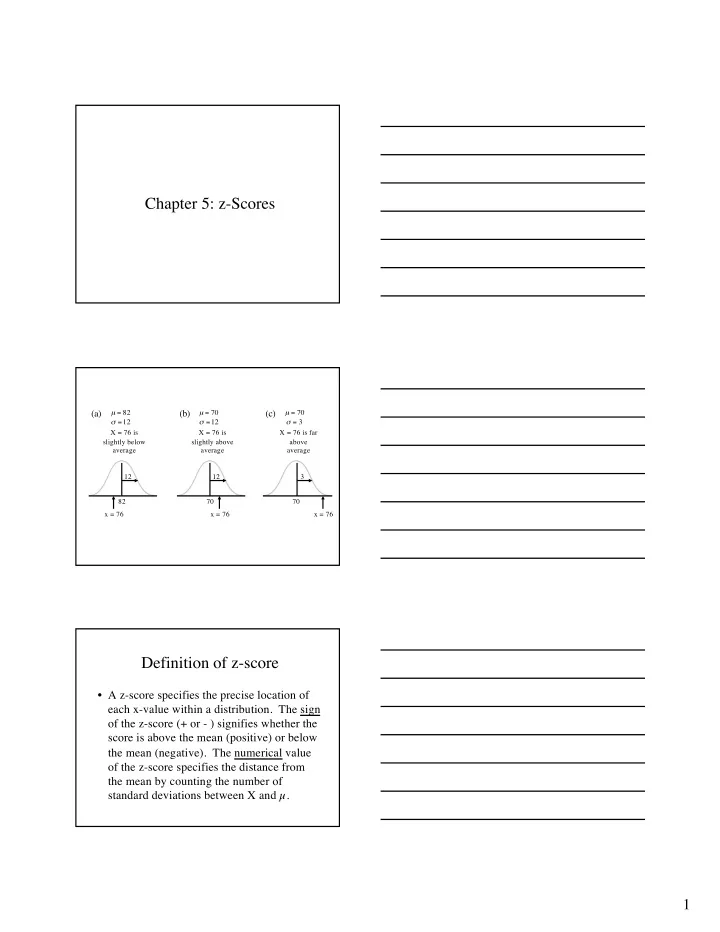
(a)
µ = 82 σ =12 X = 76 is slightly below average 12 70 x = 76
(b)
µ = 70 σ =12 X = 76 is slightly above average 3 70 x = 76
(c)
µ = 70 σ = 3 X = 76 is far above average
Definition of z-score
- A z-score specifies the precise location of
each x-value within a distribution. The sign
- f the z-score (+ or - ) signifies whether the
score is above the mean (positive) or below the mean (negative). The numerical value
- f the z-score specifies the distance from
the mean by counting the number of standard deviations between X and µ.