
SLIDE 1
Chaos and Uncertainty
The FY 2014 Defense Budget and Beyond
Todd Harrison
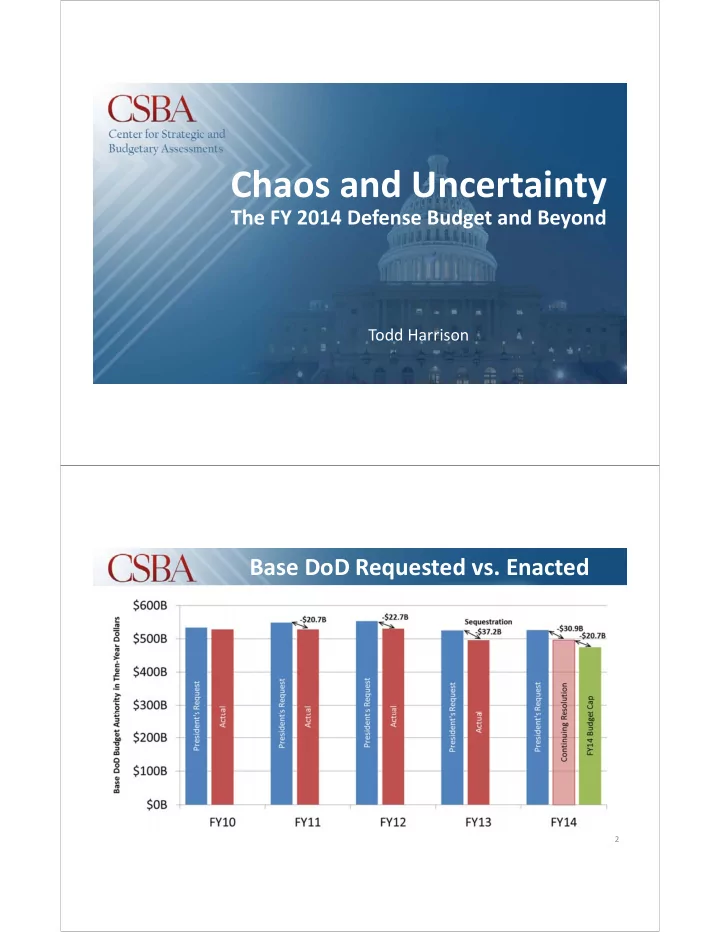
Base DoD Requested vs. Enacted
2
Chaos and Uncertainty The FY 2014 Defense Budget and Beyond Todd - - PDF document
Chaos and Uncertainty The FY 2014 Defense Budget and Beyond Todd Harrison Base DoD Requested vs. Enacted 2 FY13 Sequester % Cut from FY13 Sequester by Title Use of Prior Year Unobligated Funds for Cuts Disproportionately Cut Unobligated Various
Todd Harrison
2
3
% Cut from FY13 Sequester by Title Use of Prior Year Unobligated Funds for Cuts
Exempted Various Exceptions Meant Percentages Were Not Uniform Disproportionately Cut Unobligated Funds from Procurement and RDT&E
4 4
Proposed Reprogramming by Title Proposed Reprogramming by Service
Except for the Navy, Services Generally Rebalanced Internally Net Flow of Funds from Procurement and RDT&E to O&M Majority of MILPERS Cuts Due to Faster Than Expected Army End Strength Reductions
5
6
7
8
9
10
11
12
13
14
15
FY 2013 Enacted FY 2014 Request % Change Military Personnel Army $ 10,667,022 $ 7,309,104 ‐31% Navy $ 2,328,868 $ 1,649,798 ‐29% Air Force $ 1,265,404 $ 894,438 ‐29% Total $ 14,261,294 $ 9,853,340 ‐31% Operation and Maintenance Army $ 33,451,520 $ 37,527,659 +12% Navy $ 10,037,675 $ 8,320,189 ‐17% Air Force $ 9,344,854 $ 10,060,273 +8% Defense‐Wide $ 9,770,652 $ 7,726,350 ‐21% Total $ 62,604,701 $ 63,634,471 2% Procurement Army $ 4,087,437 $ 2,684,456 ‐34% Navy $ 1,407,241 $ 659,498 ‐53% Air Force $ 3,136,423 $ 2,147,498 ‐32% Defense‐Wide $ 1,288,099 $ 126,275 ‐90% Total $ 9,919,200 $ 5,617,727 ‐43% Research, Development, Test, and Evaluation Army $ 29,660 $ 7,000 ‐76% Navy $ 52,519 $ 34,426 ‐34% Air Force $ 3,150 $ 9,000 +186% Defense‐Wide $ 112,387 $ 22,061 ‐80%
16
FY 2013 Enacted FY 2014 Request % Change Military Personnel Army $ 10,667,022 $ 7,309,104 ‐31% Navy $ 2,328,868 $ 1,649,798 ‐29% Air Force $ 1,265,404 $ 894,438 ‐29% Total $ 14,261,294 $ 9,853,340 ‐31% Operation and Maintenance Army $ 33,451,520 $ 37,527,659 +12% Navy $ 10,037,675 $ 8,320,189 ‐17% Air Force $ 9,344,854 $ 10,060,273 +8% Defense‐Wide $ 9,770,652 $ 7,726,350 ‐21% Total $ 62,604,701 $ 63,634,471 2% Procurement Army $ 4,087,437 $ 2,684,456 ‐34% Navy $ 1,407,241 $ 659,498 ‐53% Air Force $ 3,136,423 $ 2,147,498 ‐32% Defense‐Wide $ 1,288,099 $ 126,275 ‐90% Total $ 9,919,200 $ 5,617,727 ‐43% Research, Development, Test, and Evaluation Army $ 29,660 $ 7,000 ‐76% Navy $ 52,519 $ 34,426 ‐34% Air Force $ 3,150 $ 9,000 +186% Defense‐Wide $ 112,387 $ 22,061 ‐80%
17
18
Timing of procurement cycles follow overall budget. Past two cycles returned to a floor of ~$62B in FY14 dollars. RDT&E budget has already fallen as much as in prior drawdowns
19
Cost per person has grown faster during previous drawdowns. Excluding OCO, O&M per person has grown steadily at 2.8% annually.
20 Base + OCO Base Only
Air Force’s average budget share from FY55‐FY67 was 42%. Navy averaged 33%
FY72‐FY03. Defense‐wide accounts have grown even during downturns.
21
22
23
24
25