
SLIDE 1
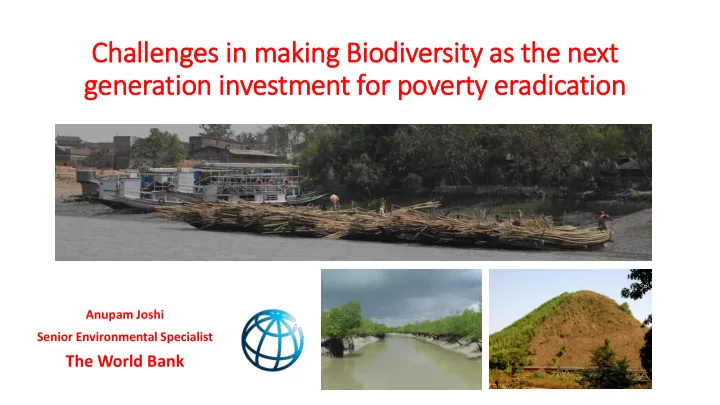
Challenges in in making Bio iodiversity as the next xt generation in investment for poverty eradication
Anupam Joshi Senior Environmental Specialist
Challenges in in making Bio iodiversity as the next xt generation - - PowerPoint PPT Presentation
Challenges in in making Bio iodiversity as the next xt generation in investment for poverty eradication Anupam Joshi Senior Environmental Specialist The World Bank Key challenges? Generally believed that infrastructure led growth model
Anupam Joshi Senior Environmental Specialist
wealth distribution?
www.worldbank.org/biodiversity
Income, Welfare
Direct consumption
Natural Resource (Forests) Output
Input in production Direct Impact –> studied Indirect Impact –> CGE, hedonic price approach, contingent valuation methods………
30% of income
households
environment than poorer households.
the environment for their income
poor within India
10,000 20,000 30,000 40,000 50,000 60,000 70,000 80,000 90,000
Bottom 20% 20-40% 40-60% 60-80% Top 20% Total
Income (Rupees)
Income Quintile
Income from other sources Livestock net income Agricultural net income Income from businesses Wage income from paid work Non-forest environmental income Total Income from Fishing and Aquaculture Direct and forest- derived income
East Asia and Pacific Europe and Central Asia Latin America and Caribbean Middle East and North Africa South Asia Sub Saharan African World
10 20 30 40 50 60 1000 2000 3000 4000 5000 6000 7000 8000 9000 10000
Percentage of Forest Land Area
Adjusted Net National Per Capita Income in $
Forest Land Area and Adjusted Net Natioanl Income Per Capita of Different Regions
Bubble size is % forest area
Data Source: Little Green Data Book (2015), World Bank
Data Sources
national and sub-national levels
mangrove forests
189 projects totaling $4.98 b operating in 90 countries
million hectares of protected areas; significant portions of the newly created protected areas are on indigenous land. The indigenous people have received legal rights over the land and security of access to its resources in return for conserving the land. ARPA will prevent emission of 430 million tons of carbon by 2050
Development Project is improving the grasslands/savannas for economic benefits of local population
percent of the whole GEF portfolio but accounted for one-third of all co-financing. Without the Bank’s projects the GEF co-financing ratio would fall from 4.5:1 to 3.1:1
Global Tiger Initiative, Coral Triangle Initiative, Save Our Species, Critical Ecosystem Partnership Fund etc.
etc.
Forests, Watersheds & Sustainable Landscapes
renewable natural capital across landscapes
Marine, Coastal & Aquatic Resources
wealth of marine, coastal and fresh water economies
Pollution Management & Environmental Health
pollution to improve environmental conditions
Fostering economics and institutions for sustainable and sustained growth
Clean and Resilient Growth
Managing risks and creating opportunities to advance sustainable development
Environmental Risk Management & Sustainability