
SLIDE 1
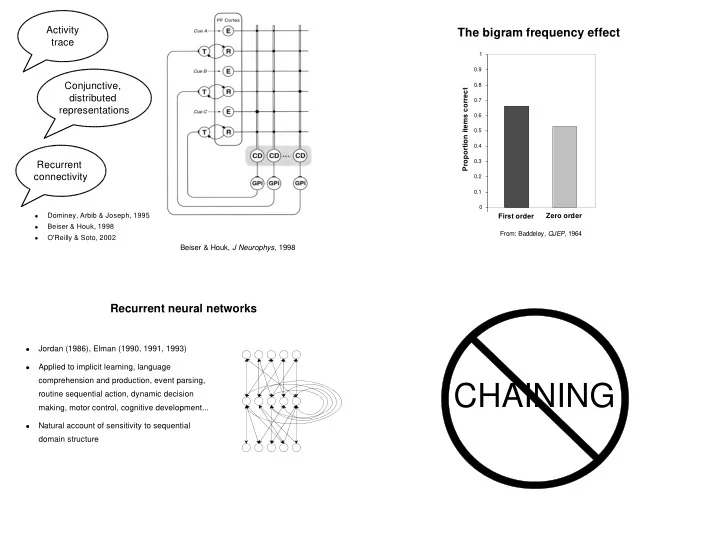
Beiser & Houk, J Neurophys, 1998
Activity trace Conjunctive, distributed representations Recurrent connectivity
- Dominey, Arbib & Joseph, 1995
- Beiser & Houk, 1998
- O'Reilly & Soto, 2002
Recurrent neural networks
- Jordan (1986), Elman (1990, 1991, 1993)
- Applied to implicit learning, language
comprehension and production, event parsing, routine sequential action, dynamic decision making, motor control, cognitive development...
- Natural account of sensitivity to sequential
domain structure
From: Baddeley, QJEP, 1964
0.1 0.2 0.3 0.4 0.5 0.6 0.7 0.8 0.9 1
Proportion items correct First order Zero order
The bigram frequency effect