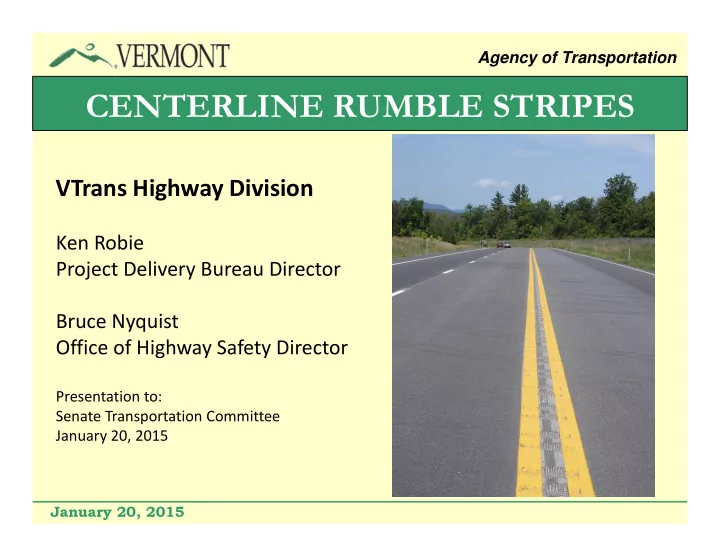

Agency of Transportation CENTERLINE RUMBLE STRIPES VTrans Highway Division Ken Robie Project Delivery Bureau Director Bruce Nyquist Office of Highway Safety Director Presentation to: Senate Transportation Committee January 20, 2015 January 20, 2015
Agency of Transportation WHAT ARE CENTERLINE RUMBLE STRIPES? January 20, 2015
Agency of Transportation WHY INSTALL CENTERLINE RUMBLE STRIPES? January 20, 2015
Agency of Transportation Statewide 3943 Crashes 94 Fatalities 1788 Injuries January 20, 2015
Agency of Transportation CLRS CRASH REDUCTION STATISTICS In the US: 44% Reduction of Head ‐ on Fatal and Injury Crashes on Rural Two ‐ Lane Roads In Vermont: • 11% Reduction of all crashes • 32% Reduction in injury related crashes January 20, 2015
Agency of Transportation CURRENT VERMONT CLRS LOCATIONS Marlboro – Brattleboro (2010) VT 9 9.30 miles Highgate ‐ Sheldon (2014) VT 78 4.19 miles Waitsfield ‐ Duxbury (2014) VT 100 3.93 miles Rockingham ‐ Clarendon (2014) VT 103 23.68 miles Sheldon – Enosburg (2010) VT 105 9.49 miles Stockbridge ‐ Bethel (2014) VT 107 7.01 miles St. Johnsbury – Guildhall (2012) US 2 21.74 miles Alburgh ‐ Colchester (2014) US 2 28.30 miles Mendon – Killington (2009) US 4 6.73 miles Woodstock ‐ Hartford (2013) US 4 9.22 miles Fair Haven (2011) US 4 0.12 miles Putney ‐ Westminster (2014) US 5 3.78 miles Bennington – Manchester (2012) US 7 19.35 miles Brandon – Middlebury (2014) US 7 9.40 miles Westminster (2014) Westminster St. Highway 0.65 miles TOTAL 157 miles TOTAL (2014 PROJECTS) 81 miles January 20, 2015
Agency of Transportation POTENTIAL 2015 CLRS LOCATIONS Williston VT 2A 1.04 miles* Bethel ‐ Randolph VT 12 6.14 miles* Randolph VT 66 7.19 miles* Lemington ‐ Canaan VT 102 10.48 miles* Thetford VT 113 7.97 miles* Canaan VT 114 0.59 miles* Essex ‐ Richmond VT 117 6.85 miles* Hancock VT 125 6.50 miles* Westfield ‐ Troy VT 242 6.50 miles* South Burlington US 2 2.18 miles* Berlin US 302 1.90 miles* The projects noted above represent projects that will be under construction or advertised in calendar year 2015. * Length represents overall project length, not the length of CLRS. Each project will undergo an evaluation to identify locations where CLRS should be installed. Selected locations would meet criteria associated with traffic volume, vehicle speed, residential offsets, as well as additional criteria presented in subsequent slides. January 20, 2015
Agency of Transportation CLRS ARE CONSIDERED WHERE • Pavement width is 28 feet or greater • Speed limit is 45 mph or higher • Average Daily Traffic is 1500 vehicles per day or greater • The above criteria are not met, but the crash history indicates a pattern of head on, sideswipe, or single vehicle crashes January 20, 2015
Agency of Transportation CLRS ARE DISCONTINUED AT • Centerline breaks (ex. intersections and RR crossings) • Residences within 100 feet of centerline • Raised medians • Two way left turn lanes (TWTL) • Closely spaced commercial drives with high volume turning traffic • Narrow bridges • Bridges or concrete roadways with less than 2.5” of pavement January 20, 2015
Agency of Transportation NOISE INFORMATION VTrans has performed various studies related to noise associated with • centerline rumble stripes Sheldon – Enosburg (50 mph, 50 feet from road) • – Passenger Car: No Rumble – 71 db, Rumble – 73 db – Pickup Truck: No Rumble – 71 db, Rumble – 74 db – Dump Truck: No Rumble – 76 db, Rumble – 78 db • In some installations the decibel increase has been up to 5 ‐ 8 db after installation. Low Frequency increases have been up to 10 db • Findings – over time, noise decreases due to wear of the pavement surface • Duration of Activation ‐ Averages approx. 1 second • Frequency of Activation ‐ Varies: Avg. 12 times/day, in one project that is four years old, to 40 – 100 times/day on a recent installation January 20, 2015
Agency of Transportation DISCUSSION January 20, 2015
Recommend
More recommend