
SLIDE 1
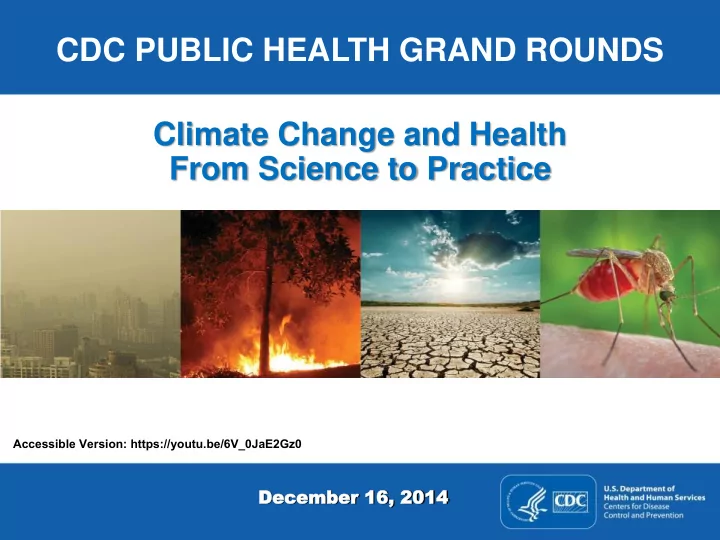
CDC PUBLIC HEALTH GRAND ROUNDS
December December 16, 2014 16, 2014
Climate Change and Health From Science to Practice
Accessible Version: https://youtu.be/6V_0JaE2Gz0
CDC PUBLIC HEALTH GRAND ROUNDS Climate Change and Health From - - PowerPoint PPT Presentation
CDC PUBLIC HEALTH GRAND ROUNDS Climate Change and Health From Science to Practice Accessible Version: https://youtu.be/6V_0JaE2Gz0 December December 16, 2014 16, 2014 Assessing the Impact of Climate Change on Health George Luber, PhD
Accessible Version: https://youtu.be/6V_0JaE2Gz0
2
3
4
Melillo, Jerry M., Terese (T.C.) Richmond, and Gary W. Yohe, Eds., 2014: Climate Change Impacts in the United States: The Third National Climate Assessment. U.S. Global Change Research Program
5
Melillo, Jerry M., Terese (T.C.) Richmond, and Gary W. Yohe, Eds., 2014: Climate Change Impacts in the United States: The Third National Climate Assessment. U.S. Global Change Research Program
6
Melillo, Jerry M., Terese (T.C.) Richmond, and Gary W. Yohe, Eds., 2014: Climate Change Impacts in the United States: The Third National Climate Assessment. U.S. Global Change Research Program
7
Melillo, Jerry M., Terese (T.C.) Richmond, and Gary W. Yohe, Eds., 2014: Climate Change Impacts in the United States: The Third National Climate Assessment. U.S. Global Change Research Program
8
Melillo, Jerry M., Terese (T.C.) Richmond, and Gary W. Yohe, Eds., 2014: Climate Change Impacts in the United States: The Third National Climate Assessment. U.S. Global Change Research Program
9
1 2 3 4 5
Cooler than average Average (mean summer temp 1951 - 1980) Warmer than average Baseline (1951 - 1980)
0.5 0.4 0.3 0.2 0.1
NASA/GISS; Hansen, et al., “Perceptions of Climate Change,” Proc. Natl. Acad. Sci. USA 10.1073, August 2012
10
NASA/GISS; Hansen, et al., “Perceptions of Climate Change,” Proc. Natl. Acad. Sci. USA 10.1073, August 2012 SD: standard deviation
1 2 3 4 5
Cooler than average Average (mean summer temp 1951 - 1980) Warmer than average Baseline (1951 - 1980) Extremely hot (>3 SD)
0.5 0.4 0.3 0.2 0.1
11
NASA/GISS; Hansen, et al., “Perceptions of Climate Change,” Proc. Natl. Acad. Sci. USA 10.1073, August 2012 SD: standard deviation
1 2 3 4 5
Cooler than average Average (mean summer temp 1951 - 1980) Warmer than average Baseline (1951 - 1980) Extremely hot (>3 SD)
0.5 0.4 0.3 0.2 0.1
12
NASA/GISS; Hansen, et al., “Perceptions of Climate Change,” Proc. Natl. Acad. Sci. USA 10.1073, August 2012 SD: standard deviation
1 2 3 4 5
Cooler than average Average (mean summer temp 1951 - 1980) Warmer than average Baseline (1951 - 1980) Extremely hot (>3 SD)
0.5 0.4 0.3 0.2 0.1
“Extreme” temperature events used to cover 0.1%
cover 10%.
13
Vandentorren et al. Am J Public Health 2004; 94(9):1518-20. Haines et al. Public Health 2006;120:585-96. UK: United Kingdom
14
Melillo, Jerry M., Terese (T.C.) Richmond, and Gary W. Yohe, Eds., 2014: Climate Change Impacts in the United States: The Third National Climate Assessment. U.S. Global Change Research Program
15
16 16
17 17
FEMA/Andrea Booher (post-Sandy); Frans Lanning/Corbis (wildfire) National Medical Association and George Mason University Center for Climate Change Communication, June 25, 2014
18 18
USGCRP, 3 rd National Climate Assessment, Downloads and Materials, available at: www.globalchange.gov/nca3-downloads-materials
19 19
Figure 9.1, Health chapter, NCA3 [from Sheffield et al. 2011); USGCRP, 3rd National Climate Assessment, Downloads and Materials, available at: www.globalchange.gov/nca3-downloads-materials
20 20
Figure 9.2, Health chapter, NCA3 (from Ziska et al. 2011) Photo: Lew Ziska
21 21
Figure 9.3, NCA3 Health chapter [Moderate Resolution Imaging Spectroradiometer (MODIS) instrument on the Terra satellite, Land Rapid Response Team, NASA/GSFC. From Sapkota et al. 2002 and Kinney 2008
22 22
Figure 9.4, Health chapter NCA3; NOAA NCDC / CICS-NC RCP: Representative Concentration Pathways
23 23
Figure 9.6, Health chapter NCA3; NOAA NCDC/CICS-NC Photo: Floodbreak RCP: Representative Concentration Pathways
Flooding of Lourdes Hospital, Binghamton NY, 2006
24 24
Figure 9.7, Health chapter NCA3; NOAA NCDC/CICS-NC
25 25
Figure 9.8, NCA3 Health chapter Figure source: NASA Earth Observatory Photo: AP/Haraz N. Ghanbari
26 26
USGCRP, 3rd National Climate Assessment: www.globalchange.gov/nca3-downloads-materials. Hospital photo Tipz4yo.
27 27
Figure 9.9, Health chapter NCA3 US Census Bureau, 2010 summary file (left); CDC Diabetes Data and Trends 2013 (right)
The proportion of Americans age 65 or older is growing at the fastest rate in a century. Older adults are more vulnerable to extreme heat, air pollution, and infectious illnesses The number of Americans diagnosed with diabetes has grown sharply over 50 years. Those with diabetes are more vulnerable to heat-related illnesses
28 28
USGCRP, 3rd National Climate Assessment, Downloads and Materials, available at: www.globalchange.gov/nca3-downloads-materials
29 29
Figure 9.10, Health chapter NCA3 Figure source: Kent 2006 Photo: Michael Rieger/FEMA
30 30
USGCRP, 3rd National Climate Assessment, Downloads and Materials, available at: www.globalchange.gov/nca3-downloads-materials
31
From Grabow et al. (2012); Patz et al. (2008) Human Health chapter (ch.9, pp. 232 and 226), NCA3
32
33 33
34 34
35 35
www.avma.org/KB/Resources/Reports/Documents/onehealth_final.pdf
36 36
U.S. Global Change Research Program. The Third U.S. National Climate Assessment, 2014. nca2014.globalchange.gov/report K.R. Smith, A. Woodward, D. Campbell-Lendrum, D.D. Chadee, Y. Honda, Q. Liu, J.M. Olwoch, B. Revich, and R. Sauerborn, 2014: Human health: impacts, adaptation, and co-benefits. In: Climate Change 2014: Impacts, Adaptation, and Vulnerability. Part A: Global and Sectoral Aspects. Contribution of Working Group II to the Fifth Assessment Report of the Intergovernmental Panel on Climate Change. www.ipcc.ch/report/ar5/wg2
37 37
Luber, G., et al. 2014: Ch. 9: Human Health. Climate Change Impacts in the United States: The Third National Climate Assessment, J. M. Melillo, Terese (T.C.) Richmond, and G. W. Yohe, Eds., U.S. Global Change Research Program, 220-256 Gage, K. L., T. R. Burkot, R. J. Eisen, and E. B. Hayes. American Journal of Preventive Medicine, 35, 436-450
38 38
39 39
40 40
41 41
JE: Japanese encephalitis
42 42
Reisen et al. 2006. J. Med. Entomol. 43: 309–317 Chuang et al, 2011. J. Med. Entomol. 48: 669–679 Morin & Comrie, 2013. PNAS; doi:10.1073/pnas.1307135110
43 43
44 44
45 45
46 46
Brownstein, J. S., T. R. Holford, and D. Fish. 2003. Environ Health Persp 111: 1152-1157 Eisen, L., R. J. Eisen, and R. S. Lane. 2002. Med Vet Entomol 16: 235-244 Yuval, B., and A. Spielman. 1990. J Med Entomol 27: 196-201 Moore, S. M., R. J. Eisen, A. Monaghan, and P. Mead. 2014. Am J Trop Med Hyg 90: 486-496
47
5,000 10,000 15,000 20,000 25,000 30,000 35,000 40,000 45,000
1996 1997 1998 1999 2000 2001 2002 2003 2004 2005 2006 2007 2008 2009 2010 2011 2012 2013
*National Surveillance case definition revised in 2008 to include probable cases;
details at www.cdc.gov/ncphi/disss/nndss/casedef/lyme_disease_2008.htm
Probable cases* Confirmed cases
48
www.cdc.gov/lyme/stats/maps/interactiveMaps.html
49
Map source: www.cdc.gov/lyme/stats/maps/interactiveMaps.html Ogden NH, Radojevic M, Wu X, Duvvuri VR, Leighton PA, Wu J.Environ Health Perspect. 2014 Jun;122(6):631-8.
50 50
Matthew A. Dixon, Osman A. Dar and David L. Heymann. Veterinary Record 2014 174: 546-551.
Human encroachment, extractive industries, deforestation, habitat fragmentation, biodiversity loss, urbanization and urban planning
Intensifying/expanding farming systems, greater livestock density, trade networks and globalization, unregulated/irregular use of drugs and vaccines, livestock mixing patterns, biosecurity
Hunting and consumption practices, cultural patterns and processes, travel capabilities, breakdown of governance, antimicrobial usage patterns
Climate change, natural disasters, periodic climate systems
51 51
52 52
53
54
55
56
CRSCI: Climate-ready Cities and States Initiative
57
1 Forecasting Climate Impacts and Assessing Vulnerabilities 2 Projecting the Disease Burden 3 Assessing Public Health Interventions 4 Developing and Implementing a Climate and Health Adaptation Plan 5 Evaluating Impact and Improving Quality of Activities
Climate and Health Program, National Center for Environmental Health, CDC
58
www.nasa.gov/centers/goddard/news/topstory/2005/nyc_heatisland.html
59
www.nasa.gov/centers/goddard/news/topstory/2005/nyc_heatisland.html
60
61
62
63
For more information, please contact Centers for Disease Control and Prevention 1600 Clifton Road NE, Atlanta, GA 30329 Telephone: 1-800-CDC-INFO (232-4636) TTY: 1-888-232-6348 E-mail: cdcinfo@cdc.gov Web: http://www.cdc.gov
National Center for Environmental Health Division of Environmental Hazards and Health Effects
64