causality workshop 2018 the book of why
play

Causality Workshop 2018 The book of WHY published in May 2018 - PowerPoint PPT Presentation

Causality Workshop 2018 The book of WHY published in May 2018 current amazon bestseller #1 in the category statistics (followed by Elements of Statistical Learning) Pearl received the Turing Award 2011 Beate Sick 1 Topics of today


  1. Causality Workshop 2018 The book of WHY 
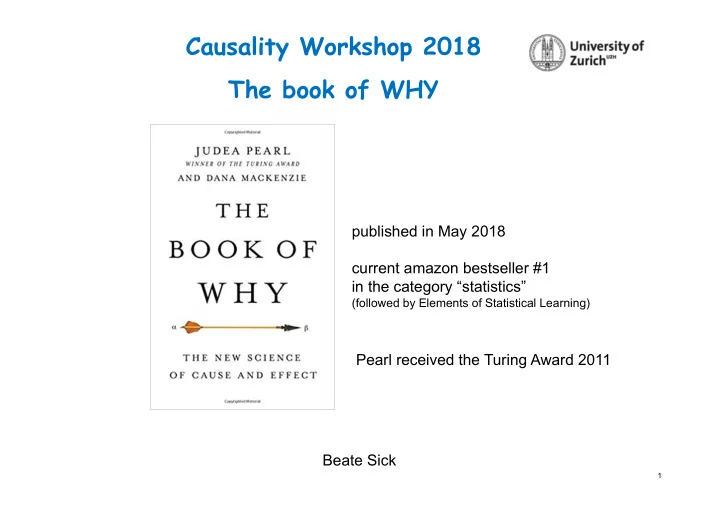
published in May 2018 current amazon bestseller #1 in the category “statistics” (followed by Elements of Statistical Learning) Pearl received the Turing Award 2011 Beate Sick 1

  2. Topics of today  Humans and scientists want/need to understand the “WHY”  Correlation: birth of statistics – end of causal thinking?  Regression to the mean  Pearl’s ladder of causation  Can our statistical and ML/DL models “only do curve fitting” ?  Historic anecdotes in statistics and ML seen through a causal lens 2

  3. Humans conscious rises the question of WHY? God asks for WHAT “Have you eaten from the tree which I forbade you?” Adam answers with WHY “The woman you gave me for a companion, she gave me fruit from the tree and I ate.”

  4. For intervention planning we need to understand the WHY Heart ? HDL disease Epidemiological studies of CHD and the evolution of preventive cardiology Nature Reviews Cardiology 11, 276–289 (2014) HDL gives a strong negative association with heart disease in cross-sectional studies and is the strongest predictor of future events in prospective studies. Roche tested the effect of drug “dalcetrapib” in phase III on 15’000 patients which proved to boost HDL (“good cholesterol”) but failed to prevent heart diseases. Roche stopped the failed trial on May 2012 and immediately lost $5billion of its market capitalization. 4

  5. We need to understand causality to plan intervention Do violent video games cause violence among young people? Then ban them! Aargauer Zeitung Does unconditional basic income crank up economy? Then launch it! 5

  6. Galton on the search for causality Francis Galton (first cousin of Charles Darwin) was interested to explain how traits like “intelligence” or “height” is passed from generation to generation. Galton in 1877 at the Friday Evening Discourse at the Royal Institution of Great Britain in London. Galton presented the “quincunx” (Galton nailboard) as causal model for the inheritance. Balls “inherit” their position in the quincunx in the same way that humans inherit their stature or intelligence. The stability of the observed spread of traits in a population over many generations contradicted the model and puzzled Galton for years. Image credits: “The Book of Why”

  7. Galton’s discovery of the regression line Remark: Correlation of IQs of parents and children is only 0.42 https://en.wikipedia.org/wiki/Heritability_of_IQ      2  2 ~ N 100, 15 X1 1 1 slope 1      2  2 ~ N 100, 15 X2 1 1 IQ distribution in sons with N        100  2 E(IQ sons )=112 X1 15 cov( X1,X2 ) ~  ,          100 2  X2    cov( X1,X2 ) 15     with IQ of sons IQ fathers =115 Groups of fathers with IQ=115 IQ of fathers For each group of father with fixed IQ, the mean IQ of their sons is closer to the overall mean IQ (100) -> Galton aimed for a causal explanation. All these predicted E(IQ son ) fall on a “regression line” with slope<1. Image credits (changed): https://www.youtube.com/watch?v=aLv5cerjV0c

  8. Galton’s discovery of the regression to the mean phenomena      2  2 ~ N 100, 15 X1 1 1 slope 1      2  2 ~ N 100, 15 X2 1 1 IQ distribution in fathers with 0.8SD N        100  2 E(IQ fathers )=112 X1 15 cov( X1,X2 ) ~  ,          100 2  X2    cov( ) 15   X1,X2   with IQ sons =115 1SD IQ of sons IQ of fathers Also the mean of all fathers who have a son with IQ=115 is only 112. Image credits (changed): https://www.youtube.com/watch?v=aLv5cerjV0c

  9. Galton’s discovery of the regression to the mean phenomena      2  2 ~ N 100, 15 X1 1 1      2  2 ~ N 100, 15 X2 1 1 IQ distribution in fathers with E(IQ fathers )=112 N        100  2 X1 15 cov( X1,X2 ) ~  ,    with IQ sons =115       100 2  X2    cov( ) 15   X1,X2   IQ of fathers Groups of sons with IQ=115 IQ of sons After switching the role of sons’s IQ and father’s IQ, we again see that E(IQ fathers ) fall on the regression line with the same slope <1. There is no causality in this plot -> causal thinking seemed unreasonable. Image credits (changed): https://www.youtube.com/watch?v=aLv5cerjV0c

  10. Pearson’s mathematical definition of correlation unmasks “regression to the mean” as statistical phenomena After standardization of the RV:      2  2 ~ N 0, 1 X1 1 1      2  2 ~ N 0, 1 X2 2 2           0 2 X1 1 c ~ N  , X 1            0 2  X2    c 1     X 2 Regression line equation:   ˆ       X E X | X X 2 2 1 0 1 1  � � quantifies stand.     c 2 c regression to 1  The correlation c of a bivariate Normal distributed the mean 1 pair of random variables are given by the slope of the regression line after standardization! 1 n     ( x x ) ( x x )  i1 1 i2 2 c quantifies strength of linear relationship n 1   c i 1  sd( ) sd( x x ) and is only 1 in case of deterministic relationship. 1 2

  11. Intuitive explanation of “regression to the mean” IQ test result (at both time points) = true IQ + luck or bad luck IQ in test 2 Not reproducible in second test IQ in test 1 To get this test result, a person might - have truly this high IQ (this are some people) - have a lower true IQ ( many people have a lower IQ) but had luck - have a higher true IQ ( fewer people have a higher IQ) but had bad luck

  12. Regression to the mean occurs in all test-retest situations result in test 2 result in test 1 Retesting a extreme group (w/o intervention in between) in a second test leads in average to a results that are closer to the overall-mean -> to assess experimentally the effect of an intervention also a control group is needed!

  13. With the correlation statistics was born and abandoned causality as “unscientific” “the ultimate scientific statement of description of the relation between two things can always be thrown back upon… a contingency table [or correlation].” Karl Pearson (1895-1936), The Grammar of Science Pearl’s rephrasing of Pearson’s statment: “ data is all there is to science ”. However, Pearson himself wrote several papers about “spurious correlation” vs “organic correlation” (meaning organic=causal?) and started the culture of “think: ‘caused by’, but say: ‘associated with’ ”… 13

  14. Quotes of data scientists “Considerations of causality should be treated as they have always been in statistics: preferably not at all." Terry Speed, president of the Biometric Society 1994 In God we trust. All others must bring data. W. Edwards Deming (1900-1993), statistician and father of the total quality management See also http://bigdata-madesimple.com/30-tweetable-quotes-data-science/ 14

  15. Pearl’s statements Observing [and statistics and AI] entails detection of regularities We developed [AI] tools that enabled machines to reason with uncertainty [Bayesian networks].. then I left the field of AI Mathematics has not developed the asymmetric language required to capture our understanding that if X causes Y . As much as I look into what’s being done with deep learning, I see they’re all stuck there on the level of associations. Curve fitting. The book of Why https://www.quantamagazine.org/to-build-truly-intelligent-machines-teach-them-cause-and-effect-20180515/ 15

  16. Probabilistic versus causal reasoning Traditional statistics, machine learning, Bayesian networks • About associations (are stork population and human birth number per year are associated?) • The dream is a models for the joined distribution of the data • Conditional distribution are modeled by regression or classification (if we observe a certain number of storks, what is our best estimate of human birth rate?) Causal models • About causation (do storks do affect human birth rate?) • The dream is a models for the data generation • Predict results of interventions (if we change the number of storks, what will happen with the human birth rate?) 16

  17. Pearl’s ladder of causality Image credits: “The Book of Why” 17

  18. Regression Model What can they tell us? 18

  19. On the first rung of the ladder Pure regression can only model associations          t 2 (Y | X ) ~ N( X x ... x , )   i i i 0 1 i 1 p 1 ip 1 Usual interpretation: The coefficient  k gives the change of the outcome y, given the explanatory variable x k is increased by one unit and all other variables are held constant. But: How can we increase just one predictor and hold the others constant? Interpretation for biostatistical problems:  k is the amount the outcome would change had the participant shown a covariate x k increased by one unit – all other do not change ;-) 19

  20. How we work with rung-1 regression or ML models 20

Download Presentation
Download Policy: The content available on the website is offered to you 'AS IS' for your personal information and use only. It cannot be commercialized, licensed, or distributed on other websites without prior consent from the author. To download a presentation, simply click this link. If you encounter any difficulties during the download process, it's possible that the publisher has removed the file from their server.

Recommend


More recommend