SLIDE 1 1 Tokyo, Japan 22 November 2011
& test
Heterogeneous Catalysis Electrocatalysis Photocatalysis
The common denominator is surface science where the functionality of nanoparticles plays an essential role for catalysis in energy harvesting, conversion and environmental protection.
Catalysis for sustainable energy:
The challenge of harvesting and converting energy
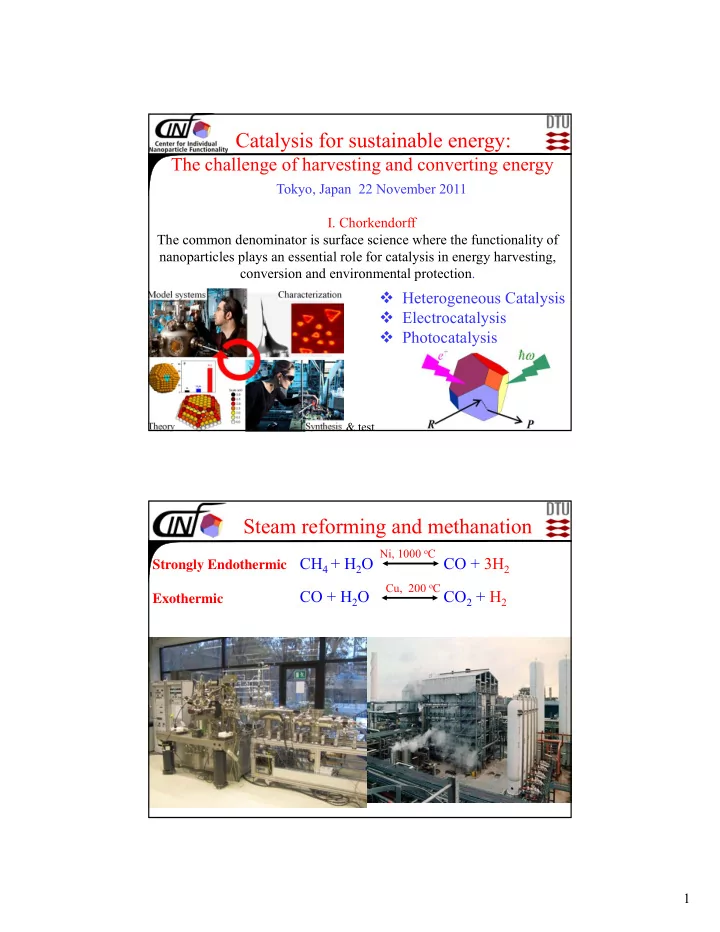
Steam reforming and methanation
CH4 + H2O CO + 3H2 CO + H2O CO2 + H2
Strongly Endothermic Exothermic
Ni, 1000 oC Cu, 200 oC
SLIDE 2 2 240L CO at 500K
Deposition at 500K on Ni(14 13 13)
The barrier fro CO dissociation is measured experimentally to be 1.5-1.6 eV
The Steam Reforming
Major entropy loss involved in going from gas phase to adsorbed state T=773K Methane becomes RLSfor Nickel at High T Steam reforming Methanation
CH4 + H2O CO + 3H2
Ru slightly better than Ni Ru Ni
SLIDE 3 3
Two-dimensional volcano-curve of rate for steam reforming
T = 773K, P = 1 bar; 10% conversion 0.2 eV error bars Ru, Rh, Ni are equally
Based on micro kinetic model using scaling laws (BEP)
- G. Jones, J. G. Jakobsen, S. S. Shim, J. Kleis, M. P. Andersson, J. Rossmeisl, F. Abild-Pedersen,
- T. Bligaard, S. Helveg, B. Hinnemann, J. R. Rostrup-Nielsen, I. Chorkendorff, J. Sehested, and J.
- K. Nørskov, J. Catal. 259 (2008) 147.
Catalysis for sustainable Energy (CASE)
14 W/m2 0.7 W/m2 4 W/m2
SLIDE 4 4
Electrifying seems to be the future
Solar, Wind, and Hydro, Energyr Electricity Consumer
Biomass Power plant
Electrolysis/Fuel Cells H2 and O2
H2 Storage Opgrading Biomass
Fuels for long distance transport
Chemicals
CO2 Hydrogenation CH4, CH3OH...
Fuel Storage H2 CO2 8H+ + CO2 +8e- = C2H4+ 2H2O 3H2 + CO2 = CH3OH + H2O
Possible Solar Fuels
4H2 + CO2 = CH4 + 2H2O
- Y. Hori, Modern Aspects of Electrochemistry, vol. 42, pp. 89-189 2008.
SLIDE 5 5
Averaging renewal energy sources
Cathode: 2(H++e-) H2 Anode: H2O ½ O2 +2 H+
____________________________________
Total: H2O ½ O2 +H2 G0 =2.46 eV (1.23 eV/electron) Could be a route for averaging out sustainable energy production i.e. from wind
In DK ~ 21% power from wind alone
~3 % of total energy consumption Horns rev 80 x 2MW Electricity is good but it comes with temporal variations
SLIDE 6 6
Working Principles PEM fuel cell
Pt or Pt/Ru clusters 4e H+ H+ H+ H+
2H2+4* 4H* 4H* 4*+4e+4H+ O2+2* 2O* 4H+ +4e+4* 4H* 4H*+2O* 2H2O
Pt clusters Proton membrane ~0.7 V 2H2 Purge O2 2H2O A Nafion
Trends for Hydrogen Production Expensive and scarce
Exchange current
Some 200 Ton Pt a year Today: 1g Pt per kW or 4 million cars per year! Barrier for dissociation Bonds too strongly
J.K. Nørskov, T. Bligaard, Á. Logadóttir, J.R. Kitchin, J.G. Chen, Pandelov, and U. Stimming: J. Electrochem. Soc. 152, J23, (2005) R. Parson 1957
SLIDE 7 7 Element No
10 20 30 40 50 60 70 80 90
Earths crust abundence in ppm weight
10-7 10-6 10-5 10-4 10-3 10-2 10-1 100 101 102 103 104 105 106 107
Ne H O Ra Ir Xe Kr Ar Si He Au Pt Rh Ru Pd Pb Re Os Th U Ba Ca Fe
O Si Al Fe Ca Na Mg K Ti Sum 47,4% 27,7% 8,2% 4,1% 4,1% 2,3% 2,3% 2,1% 0,56% 98,8%
Composition of Earths Crust
Mo W
Rare Earths
The hydrogen evolution process
Hydrogen evolution U=0V
G
The most efficient materials
heat
SLIDE 8 8 A H-coverage on 3-layer slap with 16 different metals : Fe, Co, Ni, Cu, As, Ru, Rh, Pd, Ag, Cd, Sb, Re, Ir, Pt, Au, and Bi pure metal 16 pure metal overlayer 240 1/3 surface alloy 240 2/3 surface alloy 240 Leading to a total of 736 surface alloys
- G ~ 0 - No kinetics i.e. no barriers are considered
- G for surface segregation (stability of the overlayer)
- G for intra-surface transformations (island formation, de-alloying)
- G oxygen poisoning of the surface (Water splitting/oxide formation)
- G for corrosion the free energy for dissolution
( 3 3) 30 ) x R
The criteria
- J. Greeley, T. Jaramillo, J. Bonde, I. Chorkendorff, and J. K. Nørskov,
Nature Materials 5 (2006) 909.
Screening results on (√3 x √3)R30º 3-layer slabs
1/3 ML 2/3 ML 1 ML
SLIDE 9 9
Stability Criteria
180 binary surface alloys have good predicted activity Check for surface-bulk segregation effects:
Reject all alloys where
seg Side view
~105 alloys remain
Check for intrasurface rearrangements and islanding:
seg
E
Reject all alloys where surface Top view
~45 alloys remain
Check for electrochemical stripping effects: pH=0
ne M s M
n
) (
~25 alloys remain
Check for adsorption of oxygen:
~15 alloys remain
Pareto-optimal plot
The knees are always the point of interst i.e. PtBi taking uncertanity
- f DFT into consideration
- J. Greeley, T. Jaramillo, J. Bonde, I. Chorkendorff, and J. K. Nørskov,
Nature Materials 5 (2006) 909.
RhRe
SLIDE 10 10
Test of PtBisurface alloy HER
The surface alloy shows enhanced activity
- J. Greeley, T. Jaramillo, J. Bonde, I. Chorkendorff, and J. K. Nørskov,
Nature Materials 5 (2006) 909.
0.0 0.2 0.4 0.6 0.8 1.0
3
CuW75(pc) Cu(pc) W(pc) Pt(111) Pt(pc)
j / mA cm
E / V (RHE) 0.1 M HClO4 dE/dt = 5 mV s
Standard bulk alloys of CuW
SLIDE 11 11
- B. Hinnemann and J.K Nørskov, J. Am. Chem. Soc. 126, 3920 (2004)
Hydrogenase: Per Siegbahn, Adv. Inorg. Chem. 56, 101 (2004).
Nitrogenase:
How does nature do it ?
MoS2 as a catalyst for hydrogen evolution
- The coverage cannot be changed continuously.
- Probably only coverage changes between 25% and 50% contribute.
Differential hydrogen binding free energies
Model with four rows Differential free energy (eV) 25% 50% 75% 100%
0.08 0.76 0.79
SLIDE 12 12 1) Synthesis and STM
under UHV. 2) Measure electrochemical activity of the MoS2 just characterized with STM. 470 Å X 470 Å 470 Å X 470 Å
Combining surface science and electrochemistry
T.F. Jaramillo, K.P. Jørgensen, J. Bonde, J.H. Nielsen, S. Horch, I. Chorkendorff, Science 137 (2007) 100
per active site: 1 in 4 edge state atoms
MoS2 on the volcano
T.F. Jaramillo, K.P. Jørgensen, J. Bonde, J.H. Nielsen, S. Horch, I. Chorkendorff, Science 137 (2007) 100
We now know exactly where to look for improvement: Increase the hydrogen bonding to the edge!
SLIDE 13 13
Mo3S4 going small
The smallest entity of the active site of MoS2 ?
- T. F. Jaramillo, J. Zhang, B. Lean Ooi, J. Bonde, K. Andersson,
- J. Ulstrup, I. Chorkendorff, J. Phys. Chem. 112 (2008) 17492.
Z range:1.32 nm
0 0 40 nm
a b B On graphite HOPG Coverage 1*1013 cm-2~1% Fuel cell
H2O + 4h+ O2 + 4H+ 4H+ + 4e- 2H2
Small band gap < 1,1 eV Large band gap >2.0 eV
The dream device
The Helios concep (Nate Lewis)
SLIDE 14 14
Measurements on pillared structures
- UV-lithography and dry-etching of silicon
- 3 m diameter circular w 6 m spacing
- Hexagonal pattern and 60 m long
- 32000 pillars/mm2 increased area of 15
Hou Y. D., Abrams, B. L., Vesborg, P. C. K., Björketun,
- M. E., Herbst, K. et al., Nature materials, 10, 434-438 (2011).
SLIDE 15 15
The Major loss in ORR and OER
The anode reaction in a fuel cell: O2+4H++4e- = 2H2O
Adapted from Gasteiger et al. Using ΔEO as a ‘descriptor’ for Pt alloys
All catalysts with ‘Pt-skin’ overlayers
O binds too strongly: O binds too weakly:
Need to search for new Pt-alloy catalyst with
Theoretical O adsorption energy, relative to Pt Experimental activity, relative to Pt
~
Pt O O
E E
0.2 eV
Experimental data from: Zhang et al Angew. Chem. Int. Ed., 2005; Stamenkovic et al, Angew. Chem, Int. Ed 2006; Stamenkovic et al, Science, 2007
Theoretical trends for oxygen reduction
SLIDE 16 16
Structural stability of ordered alloys
eV/atom
75 % 25 % Formation energy
L12 binary alloy structures with respect to pure metals LMTO-GGA calculations
Johannessen, Bligaard, Ruban, Skriver, Jacobsen, Nørskov, PRL 88 (2002) 255506
Pt 192.016 possible fcc and bcc alloys that can be constructed
- ut of 32 different metals.
Evolutionary Search Approach
Pt2Y2
Pt2Sc2 -1.47 Lu2Pt2 -1.41 Ir2Sc2
HfIr2Sc -1.30 . . . Pt3Sc -1.06 HfPt3 -1.03 Pt3Y -1.02 H (eV)
SLIDE 17
17
Screening of Pt3X and Pd3X alloys
Greeley, Stephens, Bondarenko, Johansson, Hansen, Jaramillo, Rossmeisl, Chorkendorff, Nørskov (2009) Nature Chemistry 1 (2009) 522
Experimental verification of theory: Activity measurements of Pt(111)
Polycrystalline Pt or Pt(111) disc electrodes cleaned and characterised under ultra high vacuum conditions. Rotating disc electrode (RDE) measurements in liquid cell with O2-saturated 0.1 M HClO4 solution, at room temperature. 5 mm
SLIDE 18 18
Kinetic rates
Greeley, Stephens, Bondarenko, Johansson, Hansen, Jaramillo, Rossmeisl, Chorkendorff, Nørskov (2009) Nature Chemistry 1 (2009) 522
C O Pt Y
50eV pass energy 150eV pass energy, background subtracted
Pt4f Y3d
Proof of Pt skin? Angle resolved XPS depth profile
(uncalibirated)
All catalysts with ‘Pt-skin’ overlayers
SLIDE 19
19
The ORR volcano II
Greeley, Stephens, Bondarenko, Johansson, Hansen, Jaramillo, Rossmeisl, Chorkendorff, Nørskov (2009) Nature Chemistry 1 (2009) 522
Alloys invested so far
Stephens, Bondarenko,Johansson, Rossmeisl, Chorkendorff, ChemCatChem (2011)
SLIDE 20 20
Specific and mass activity versus Size
F.J. Perez-Alonso, D.N. McCarthy, A. Nierhoff, C. Strebel, I. E. L. Stephens, J.H. Nielsen, and I.
- Chorkendorff. Submitted (2011)
0.5 1.0 1.5 2.0 2.5 3.0 2 4 6 8 10 12 14 1.00E+009 0.2 0.3 0.4 0.5 0.6 0.7 0.8 0.9 1.0 1.1
∞
jk /mA cmPt
theory theory
jm /mA gPt
Pt particle size diameter/ nm
Enhancement of activity
0.86 0.88 0.90 2 4 6 8 10 12 14
Activity enhancement relative to Pt ( jk/j
Pt k )
U / V (RHE)
Pt Pt3Sc Pt3Y
6.1 Polycrystalline
0.86 0.88 0.90 1 2 3 4 5 6 7
Activity enhacement relativeto Pt (JK/JK
Pt)
E(V) vs RHE Pt 5nm 25% coverage Pt3Y GC62 5nm coverage 54%
4.2 6 nm nanoparticles Pt-Y Nanoparticles can be made and they are stable on a 24 h test.
F.J. Perez-Alonso, D.N. McCarthy, A. Nierhoff, C. Strebel, I. E. L. Stephens, J.H. Nielsen, and I.
- Chorkendorff. In preparation (2011)
SLIDE 21
21
Summary
Conversion of energy: Electrolysis (Pt, IrO2, RuO2)
Fuel Cells (Pt, Ru) Synthesis of Solar Fuels (Ru, Pt,…?)
Harvesting energy: Photo electro catalysis PEC (same as
above plus semiconductor) Designing new materials with specific requirements by defining decisive factors such as: Band gap of semi conductors Binding energy of Hydrogen Binding energy of Oxygen Binding energy of specific intermediates Determining rate limiting steps (RLS)