Capture fisheries, dams, mitigations measures and alternative - - PDF document

capture fisheries dams mitigations measures and
SMART_READER_LITE
LIVE PREVIEW

Capture fisheries, dams, mitigations measures and alternative - - PDF document

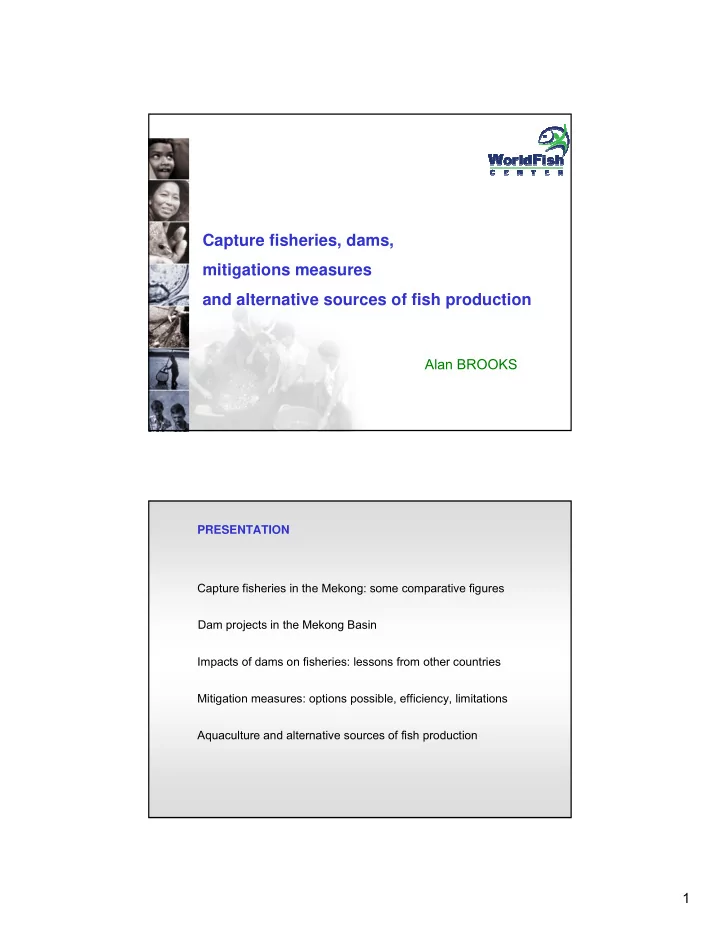
people science environment partners Capture fisheries, dams, mitigations measures and alternative sources of fish production Alan BROOKS PRESENTATION Capture fisheries in the Mekong: some comparative figures Dam projects in the


slide-1
SLIDE 1

1

people science environment partners

Alan BROOKS

Capture fisheries, dams, mitigations measures and alternative sources of fish production

Capture fisheries in the Mekong: some comparative figures PRESENTATION Aquaculture and alternative sources of fish production Impacts of dams on fisheries: lessons from other countries Mitigation measures: options possible, efficiency, limitations Dam projects in the Mekong Basin

slide-2
SLIDE 2

2

Capture fisheries in the Mekong: some comparative figures

FAO FIGIS data (www.fao.org/fishery/statistics/global-capture-production/query/en) Northern America (inland): 150,000 tonnes France (marine+ inland): 500,000 tonnes Australia (marine): 140,000 tonnes MRC assessments (inland): 2,600,000 tonnes Mekong countries (inland): 720,000 tonnes Finland (inland): 35,000 tonnes Uganda (inland): 320,000 tonnes Brazil (inland): 220,000 tonnes

755000 453000

Capture fisheries are essential to food security in the Mekong Basin

415000 181000 33000

slide-3
SLIDE 3

3

212 dams ≥ 1 MW existing or planned in the LMB

53 dams in operation or under construction or committed/priority …+ 66 projects under study + 93 candidate sites Average height of the 32 dams in operation: 51 meters

Dam projects in the LMB

5 In construction / Committed 12 7 Operating Vietnam 1 In construction / Committed 2 1 Operating Cambodia In construction / Committed 8 8 Operating Thailand 11 In construction / Committed 23 12 Operating Laos 4 In construction / Committed 8 4 Operating China

North America Columbia River: from 10-16 million migrant fish/year down to 2.5 million. Mortality of migrants: 37-51% on way up, 77-96% on way down Missouri River: loss of 80% of the catch Tennessee River: 60% loss in species richness Asia Quiantang river: - 22-38% fish biodiversity Pak Mun: 60-80% loss in catches upstream, 64% loss in biodiversity reservoir prod.: 10kg.ha-1 instead of the expected 220 kg.ha-1 no study of downstream impacts Yali: loss of 58% of livelihoods for downstream communities Europe Original biodiversity and biomass low → not much to lose Impacts of dams on fisheries: lessons from other countries

slide-4
SLIDE 4

4

Africa Senegal River: loss of 90% of fish production (no compensation by reservoir) Niger River: loss of 10% of fish production (Mali) and of 30% (Nigeria) Zambezi River: loss of 60% of coastal prawn production; poor reservoir production South America Parana River: 20% loss of biodiversity; only 2% of species cross the fish ladders Tocantins River: 26% loss in biodiversity (but new species); loss of 65-70%

  • f fish catches downstream

Sinnamary River: 37% loss in biodiversity; new species appeared. Generic patterns

  • Unregulated streams → catch of large high value fish
  • Regulated streams → lower catches of migrant but smaller fish
  • Highly regulated rivers → fisheries collapse; only black fish remain

Results from three different assessment methods indicate that the migratory fish resource at risk from Mekong mainstream dam development is in the range 0.7 – 1.6 million tonnes per year.

That amount of fish is equivalent to 1.6-3.5 times the entire beef production of Cambodia, Lao PDR, Thailand, and Viet Nam

slide-5
SLIDE 5

5

Mitigation measures: options possible, efficiency, limitations Multiple options exist before construction, during construction and after construction Before construction Location of the dam Dams located higher

  • n streams are less

damageable to fish resources than those located downstream

Primary productivity Habitat availability Predictability

Studies also show cumulative impacts

  • f multiple dams
slide-6
SLIDE 6

6

Spillway design should integrate ecological considerations Spillway design Off-take management Multiple level off-take improves water quality downstream Filling of a reservoir at the end of construction should ensure:

  • that water is released downstream
  • that sufficient flows are released for

environmental functioning and to keep a seasonal flow pattern Filling schedules During construction Optimal option: partial clearing, with areas for navigation and fishing, and uncleared areas for fish. Clearance of vegetation

slide-7
SLIDE 7

7

Reservoir aeration Several aeration technique are possible to improve reservoir

  • xygenation

After construction At all stages (preferably before and during construction) Fish passes Mainly for small to medium-size streams Only if low slope Natural bypass channels Pool fish passes

slide-8
SLIDE 8

8

Expensive, very small passage rate Vertical slot fish passes Can work well if dam height < 10m Fish locks and lifts Best mitigation system by fish passes in the world: Columbia River; 2 million fish passed every year Tonle Sap during the migration peak: 3 million fish passing EVERY HOUR There are no fish passes that can accommodate the size and intensity

  • f fish migrations

in the mainstream during the peak season in the lower part of the Mekong Fish passes are possible mitigation

  • ptions for smaller dams on

tributaries

Fish ladder of the John Day Dam (Columbia River)

slide-9
SLIDE 9

9

Enhancement Fertilization of reservoirs, Fish attraction, brush parks Sanctuaries, closed seasons Destruction of predators Yield and productivity Much variability and disputes; depends a lot on management From 200 kg.ha-1.year-1 to few kg.ha-1.year-1 Forecast of yield VERY difficult to make Stocking 1) Native species, 2) introduced species Economic viability not widely demonstrated Enhancement and stocking in reservoirs 1 Alternative sources of fish production Enhancement and stocking in reservoirs 2 Can the fishery adapt to more lacustrine environment? Viability of new reservoirs created by Dams?

  • Adaptation of species to deep water lakes and large volume pelagic
  • zones. In South America few small species adapted and main

biomass (80%) around lake fringes only.

  • Lake Kariba, Zambezi River showed that resident Clarias

gariepinus, Labeo spp., Barbus spp. all but disappeared. However small sardine-like species (Kapenta) took over and successfully dominated the fishery. Also Nam Ngum still a success after 30 years.

  • However, generally loss in biodiversity (10-60%) and catch (10-90%)

with few notable successes where a new species dominates. Indeed the World Commission on Dams concluded that 27% positive impact

  • n biodiversity while 73% showed negative impacts.
slide-10
SLIDE 10

10

Aquaculture Cam-Lao-Tha Capture fisheries Cam-Lao-Tha 200000 400000 600000 800000 1000000 1200000 1400000 1600000 1800000 2000 2001 2002 2003 2004 2005 2006 2007 Aquaculture Viet Nam

Tonnes

Vietnamese aquaculture is booming but what about aquaculture vs. capture fisheries in the other riparian countries? Aquaculture

Replacing ‘FREE’ fish?

  • Aquaculture requires inputs. Generate 1-2 million tons of fish to

replace ‘free’ fish ?….. in the context of food crisis, food security for poor?

  • Pond culture requires land – issues around smaller homesteads,

replacing rice and not poorest.

  • Some aquaculture tech demands fish seed and feed (small less

valued species) from the wild capture fisheries. Sustainability?

  • Environmental risk esp. intensive cages in rivers and reservoirs.
  • Estimate 20% increase in fish demand over next 10 years.

Aquaculture can fill this gap?

slide-11
SLIDE 11

11

In the Mekong, fish production will be negatively impacted by dam development There are multiple options for dam location and design There are multiple options for mitigation Replacement of capture fisheries by aquaculture is a

  • misnomer. Aquaculture will ameliorate fish supply after dam

development but will not replace losses from capture fisheries.

Conclusions

IWRM is well known. Integration of dam development with fisheries (for the sake of millions of fishery dependent households) should occupy very high stage in the assessment process.