
SLIDE 1
1
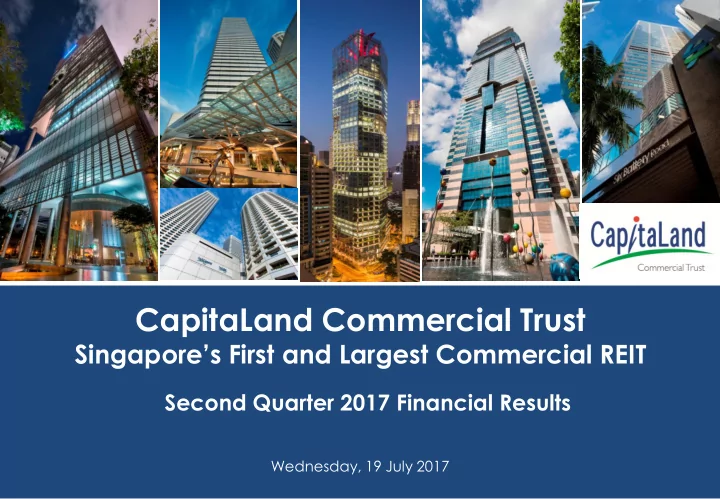
CapitaLand Commercial Trust
Singapore’s First and Largest Commercial REIT
Wednesday, 19 July 2017
CapitaLand Commercial Trust Singapores First and Largest Commercial - - PowerPoint PPT Presentation
CapitaLand Commercial Trust Singapores First and Largest Commercial REIT Second Quarter 2017 Financial Results Wednesday, 19 July 2017 1 Important Notice This presentation shall be read in conjunction with CCTs 2Q 2017 Unaudited Financial
1
Wednesday, 19 July 2017
2
CapitaLand Commercial Trust Presentation July 2017
This presentation shall be read in conjunction with CCT’s 2Q 2017 Unaudited Financial Statement Announcement.
The past performance of CCT is not indicative of the future performance of CCT. Similarly, the past performance of CapitaLand Commercial Trust Management Limited, the manager of CCT is not indicative
The value of units in CCT (CCT Units) and the income derived from them may fall as well as rise. The CCT Units are not obligations of, deposits in, or guaranteed by, the CCT Manager. An investment in the CCT Units is subject to investment risks, including the possible loss of the principal amount invested. Investors have no right to request that the CCT Manager redeem or purchase their CCT Units while the CCT Units are listed. It is intended that holders of the CCT Units may only deal in their CCT Units through trading on Singapore Exchange Securities Trading Limited (SGX-ST). Listing of the CCT Units on the SGX-ST does not guarantee a liquid market for the CCT Units. This presentation may contain forward-looking statements that involve assumptions, risks and uncertainties. Actual future performance, outcomes and results may differ materially from those expressed in forward- looking statements as a result of a number of risks, uncertainties and assumptions. Representative examples
cost of capital and capital availability, competition from other developments or companies, shifts in expected levels of occupancy rate, property rental income, charge out collections, changes in operating expenses (including employee wages, benefits and training costs), governmental and public policy changes and the continued availability of financing in the amounts and the terms necessary to support future business. You are cautioned not to place undue reliance on these forward-looking statements, which are based on the current view of the CCT Manager on future events.
3
Slide No.
*Any discrepancies in the tables and charts between the listed figures and totals thereof are due to rounding.
CapitaLand Commercial Trust Presentation July 2017
4
Capital Tower, Singapore
CapitaLand Commercial Trust Presentation July 2017
5
CapitaLand Commercial Trust Presentation July 2017
Estimated FY 2016 DPU Estimated 2H 2016 DPU
Note: (1) The estimated DPU of 2.27 cents for 2Q 2017 and 4.59 cents for 1H 2017 included additional principal amount of S$78.0 million of the convertible bonds due 12 Sep 2017 (CB 2017) being converted into 54.7 million CCT units after 30 June 2017. Assuming the remaining S$45.3 million of CB 2017 were converted on or before the books closure date, the 2Q 2017 and 1H 2017 DPUs would be reduced by 0.02 cents and 0.04 cents respectively. The current conversion price of CB 2017 is S$1.4265.
2.20 cents 4.39 cents
2.27 cents 4.59 cents
2Q 2017 2Q 2016 1H 2016 1H 2017
Estimated 2Q 2017 DPU
3.2% y-o-y Estimated 1H 2017 DPU 4.6% y-o-y
cents
6
Gross borrowings on fixed rate
Low aggregate leverage ratio(1)
Average cost of debt (2)
CapitaLand Commercial Trust Presentation July 2017
S$175.0 million convertible bonds due Sep 2017 (CB) S$51.75 million of CB converted and cancelled as at 30 Jun 2017 S$78.0 million of CB converted and cancelled from 1 Jul to 14 Jul 2017 Remaining CB is S$45.25 million Issued S$300.0 million (100.0% interest) MTN from US$2 billion Euro Medium Term Notes (MTN) programme for Raffles City Singapore Issued at interest rate of 2.6% p.a. for six-year tenure Extended debt maturity profile and refinanced debt amount in 2020 and 2021
Notes: (1) In accordance with Property Funds Appendix, CCT’s proportionate share of its joint ventures borrowings and deposited property values are included when computing the aggregate leverage ratio. The aggregate leverage of 35.2% took into account the cancellation and conversion of S$78.0 million convertible bonds due September 2017 from 1 Jul to 14 July 2017. (2) Ratio of interest expense over weighted average borrowings (excludes borrowings of RCS Trust and OGS LLP) as at 30 Jun 2017.
7
CapitaLand Commercial Trust Presentation July 2017
45,000 30,000 68,000 171,000
1Q 2017 2Q 2017
Leases signed in 2Q: 201,000 sq ft (39% are new leases) Retail space Office space
CCT portfolio committed
as at 30 Jun 2017 Core CBD market
Tenant Trade Sector Building
Mizuho Asia Partners Pte. Ltd. Banking, Insurance and Financial Services Capital Tower Nagashima Ohno & Tsunematsu Singapore LLP Legal Six Battery Road A.M. Best Asia-Pacific (Singapore) Pte. Ltd. Banking, Insurance and Financial Services Six Battery Road AEW Asia Pte Ltd Banking, Insurance and Financial Services Six Battery Road Funding Societies Pte. Ltd. Education and Services Bugis Village Escape Group Pte. Ltd. Education and Services Bugis Village
8
CapitaLand Commercial Trust Presentation July 2017
Announcement Date Divestment Net proceeds (S$ mil) Net gain (S$ mil) 2 May 2017 50% of OGS LLP 556.0(1) 79.7 3 Jul 2017 Wilkie Edge(2) 277.0 72.0 13 Jul 2017 Golden Shoe Car Park 88.0 20.0 Total 921.0 171.7
CCT 45% interest
CapitaLand 45% interest Mitsubishi Estate 10% interest
Glory Office Trust (GOT) Glory SR Trust (GSRT)
Artist’s impression of new integrated development
Fund CCT’s equity interest
Notes: (1) Total net proceeds received for the sale of One George Street was S$877
repay existing borrowings. (2) Completion of sale expected in September 2017
9
One George Street, Singapore
CapitaLand Commercial Trust Presentation July 2017
10
CapitaLand Commercial Trust Presentation July 2017
Notes: (1) Higher revenue, operating expenses and net property income mainly contributed by CapitaGreen. (2) Higher distribution from MSO Trust which holds CapitaGreen and RCS Trust which holds Raffles City Singapore. (3) The estimated DPU of 2.27 cents for 2Q 2017 included additional principal amount of S$78.0 million of the CB 2017 being converted into 54.7 million CCT units after 30 June 2017. Assuming the remaining S$45.3 million of CB 2017 were converted on or before the books closure date, the 2Q 2017 DPU would be reduced by 0.02 cents. The current conversion price of CB 2017 is S$1.4265.
2Q 2017 2Q 2016 Change (%) Remarks Gross Revenue (S$ million) 87.5 67.6 29.5
Property Operating Expenses (S$ million) (18.4) (16.1) 14.1
Net Property Income (S$ million) 69.1 51.5 34.3 Distributable Income (S$ million) 69.5 65.1 6.7
Please see note (2)
Adjusted DPU (cents) 2.27 2.20 3.2
Please see note (3) Please see note (1)
11
CapitaLand Commercial Trust Presentation July 2017
Notes: (1) Higher revenue, operating expenses and net property income mainly contributed by CapitaGreen. (2) Higher distribution from MSO Trust which holds CapitaGreen and RCS Trust which holds Raffles City Singapore. (3) The estimated DPU of 4.59 cents for 1H 2017 included additional principal amount of S$78.0 million of the CB 2017 being converted into 54.7 million CCT units after 30 June 2017. Assuming the remaining S$45.3 million of CB 2017 were converted on or before the books closure date, the 1H 2017 DPU would be reduced by 0.04 cents. The current conversion price of CB 2017 is S$1.4265.
1H 2017 1H 2016 Change (%) Remarks Gross Revenue (S$ million) 177.0 134.4 31.7
Property Operating Expenses (S$ million) (38.1) (31.0) 23.0
Net Property Income (S$ million) 139.0 103.5 34.3 Distributable Income (S$ million) 140.8 129.9 8.3
Please see note (2)
Adjusted DPU (cents) 4.59 4.39 4.6
Please see note (3) Please see note (1)
12
CapitaLand Commercial Trust Presentation July 2017
Note: (1) Estimated adjusted DPU for 1H 2017 was computed based on number of units in issue as at 14 July 2017, which had included the number of units issued arising from the conversion of a principal amount of S$78.0 million of CB 2017. The actual quantum of DPU will be announced on books closure date being Thursday, 27 July 2017, when the total amount of CB 2017 conversion notices received before books closure date are tabulated to determine the final number of CCT units that are entitled to CCT’s 1H 2017 distributable income.
13
(1)
CapitaLand Commercial Trust Presentation July 2017
Notes: (1) For reference only: Based on respective properties’ proportionate net property income contribution from 1 Jan 2017 to 30 Jun 2017. NPI from CCT’s wholly owned properties was S$120.2 million, while NPI from its 60.0% interest in Raffles City Singapore and corresponding interest in One George Street was S$52.3 million and S$19.3 million respectively. (2) CCT’s interest in One George Street was 100.0% from 1 Jan to 19 Jun 2017 and 50.0% from 20 Jun to 30 Jun 2017.
Net Property Income
Raffles City Singapore (60%), 27% CapitaGreen, 18% Six Battery Road, 14% Capital Tower, 14% One George Street, 10% HSBC Building, 5% Twenty Anson, 4% Wilkie Edge, 3% Bugis Village, 3% Golden Shoe Car Park, 2%
(2)
14
Notes: (1) NM indicates “Not Meaningful” (2) CCT’s interest in One George Street was 100.0% from 1 Jan 2017 to 19 Jun 2017 and 50.0% with effect from 20 Jun 2017 (3) The valuation of Bugis Village takes into account the right of the President of the Republic of Singapore, as Lessor under the State Lease, to terminate the said Lease on 1 April 2019 upon payment of S$6,610,208.53 plus accrued interest CapitaLand Commercial Trust Presentation July 2017
Investment Properties 31-Dec-16 30-Jun-17 Variance Variance 30-Jun-17 S$m S$m S$m % $ per sq foot Capital Tower 1,325.0 1,361.0 36.0 2.7 1,845 Six Battery Road 1,371.0 1,401.0 30.0 2.2 2,830 One George Street (50%) 507.0 558.1 51.1 10.1 2,500 One George Street (100%)
(2)
1,014.0 1,116.2 102.2 HSBC Building 455.0 456.0 1.0 0.2 2,275 Wilkie Edge 201.0 205.0 4.0 2.0 1,328 Golden Shoe Car Park 141.0 141.0
Bugis Village
(3)
48.5 47.0
384 Twenty Anson 432.0 433.0 1.0 0.2 2,094 CapitaGreen 1,603.0 1,616.0 13.0 0.8 2,302 Raffles City (60%) 1,901.4 1,950.0 48.6 2.6 NM(1) Raffles City (100%) 3,169.0 3,250.0 81.0
Portfolio Total (60% RCS & 100% OGS(2)) 8,491.9 8,726.2 234.3 2.8 Portfolio Total (60% RCS & 50% OGS(2))
15
HSBC Building where terminal yields are the same given their 999-year lease tenures.
CapitaLand Commercial Trust Presentation July 2017
Capitalisation Rates Discount Rates
Dec-11 Dec-12 Dec-13 Dec-14 Dec-15 Dec-16 Jun-17 Dec-11 Dec-12 Dec-13 Dec-14 Dec-15 Dec-16 Jun-17 Capital Tower 4.00 3.75 3.75 3.85 3.85 3.85 3.70 7.50 8.00 8.00 7.50 7.25 7.25 7.00 Six Battery Road 4.00 3.75 3.75 3.75 3.75 3.75 3.60 7.50 8.00 8.00 7.50 7.25 7.25 7.00
One George Street 4.00 3.75 3.75 3.85 3.85 3.85 3.75 7.50 8.00 8.00 7.50 7.25 7.25 7.20 HSBC Building 4.00 3.75 3.75 3.85 3.85 3.75 3.60 7.50 8.00 8.00 7.50 7.25 7.25 7.00 Twenty Anson NA 3.75 3.75 3.85 3.85 3.85 3.70 NA 8.00 8.00 7.50 7.25 7.25 7.00 Wilkie Edge 4.40 4.25 4.25 4.25 4.25 4.25 4.10 7.75 8.00 8.00 7.50 7.25 7.50 7.25 CapitaGreen NA NA NA 4.00 415 4.15 4.10 NA NA NA 7.25 7.25 7.25 7.00 Raffles City SG Office 4.50 4.25 4.25 4.25 4.25 4.25 4.10 7.50 7.50 7.35 7.50 7.25 7.25 7.00 Retail 5.40 5.40 5.25 5.25 5.25 5.25 4.85 7.75 7.80 7.65 7.50 7.50 7.50 7.25 Hotel 5.75 5.75 5.55 5.25 5.13 5.11 4.75 7.75 8.00 7.75 7.75 7.75 7.40 7.15
Notes: (1) Excludes Golden Shoe Car Park and Bugis Village, and calculated on a simple average basis (2) Knight Frank was the appointed valuer for Capital Tower, Six Battery Road, HSBC Building, Twenty Anson, CapitaGreen and Raffles City Singapore, while JLL was the appointed valuer for Golden Shoe Car Park, Bugis Village and Wilkie Edge. One George Street valuation was certified by Cushman & Wakefield.
16
0.00% 2.00% 4.00% 6.00% 8.00%
2007 2008 2009 2010 2011 2012 2013 2014 2015 2016 2017
10-year SG Bond yield CCT Capitalisation rate CCT Discount rate
Notes: (1) Source: Monetary Authority of Singapore (MAS) (2) Changes in capitalisation rates and discount rates due to varying assumptions used by different valuers
CapitaLand Commercial Trust Presentation July 2017
(1)
17
Note: (1) Deposited properties for CCT Group includes CCT’s 60.0% interest in RCS Trust and CCT’s 50.0% interest in OGS LLP (2) As at 14 July 2017, S$78.0 million of the CB 2017 were converted into 54.8 million CCT units and remaining balance of CB 2017 was S$45.3 million (3) The adjusted net asset value per unit of S$1.77 is based on the units in issue as at 14 July 2017
CapitaLand Commercial Trust Presentation July 2017
Statement of Financial Position As at 30 Jun 2017 S$ million S$ million Non-current Assets 6,866.56 Deposited Properties(1) 8,960.61 Current Assets 1,088.97
.
Total Assets 7,955.53 Net Asset Value Per Unit $1.85 Current Liabilities 269.57 Adjusted Net Asset Value Per Unit Non-current Liabilities 2,139.17 (excluding distributable income) Total Liabilities 2,408.74 as at 30 June 2017 $1.80 Net Assets 5,546.79 as at 14 July 2017 (3) $1.77 Unitholders' Funds 5,546.79 Units in issue ('000) Credit Rating as at 30 June 2017 3,006,284 A- by S&P as at 14 July 2017 (2) 3,060,964 Outlook Stable
18
1Q 2017 2Q 2017 Remarks Total Gross Debt(1)
S$3,312.0m S$3,229.0m
S$3,151.0m
(After $78.0m CB conversion)(7)
Aggregate Leverage(2)
38.1% 36.0%
35.2%
(After $78.0m CB conversion) (7)
Unencumbered Assets as % of Total Assets(3)
80% 80%
Stable Average Term to Maturity(4)
3.0 years 2.9 years
Stable Average Cost of Debt (p.a.)(5)
2.6% 2.6%
Stable Interest Coverage(6)
4.8 times 4.9 times
Stable
CapitaLand Commercial Trust Presentation July 2017
Notes: (1) Total gross debt includes CCT’s 60.0% interest of Raffles City Singapore borrowings and CCT’s 50% interest of OGS LLP borrowings. (2) In accordance with Property Funds Appendix, CCT’s proportionate share of its joint venture borrowings and deposited property values are included when computing aggregate leverage. (3) Investment properties at CCT are all unencumbered except for CapitaGreen. (4) Excludes borrowings of RCS Trust and OGS LLP. (5) Ratio of interest expense (excludes amortisation and transaction costs) over weighted average gross borrowings (excludes borrowings of RCS Trust and OGS LLP). (6) Ratio of EBITDA over finance costs includes amortisation and transaction costs (excludes borrowings of RCS Trust and OGS LLP). (7) An additional principal amount of S$78.0 million of the CB 2017 was converted into 54.7 million CCT units after 30 June 2017, hence gross debt was reduced to S$3,151.0 million and gearing reduced to 35.2%.
19 $148m (5%) $50m (2%) $75m(2%) $100m(3%) $100m(3%) $180m (5%) $290m (9%) $890m (28%) $123m(4%) $102m(3%) $52m $75m (2%) $150m (5%) $150m (5%) $72m(2%) $108m(3%) $108m $72m $290m (9%) $250m (8%) $75m(2%) $85m $150m $86m 2017 2018 2019 2020 2021 2022 2023 S$ million (% of total borrowings)
(a )
(2)
CapitaLand Commercial Trust Presentation July 2017
Notes: (1) As at 30 June 2017, the CB 2017 balance was S$123.3 million out of S$175.0 million. As at 14 July 2017, S$78.0 million of the CB 2017 were converted into CCT units and remaining balance of CB 2017 was S$45.3 million. (2) CCT repaid S$321.2 million of borrowings due 2018 to 2020 with proceeds from divestment of One George Street to OGS LLP (3) RCS Trust refinanced part of borrowings due 2020 and 2021 with 6-year 2.6% p.a. medium term note due 2023 of S$300.0 million (CCT’s 60% interest is S$180.0 million) (4) OGS LLP drew down S$580.0 million secured borrowings due 2021 (CCT’s 50.0% interest is S$290.0 million)
(1) (2) (2) (2) (3) (3) (3) (4)
20
OGS LLP bank loan $290m RCS Trust bank loans $166m Borrowings on Fixed Rate 85% Borrowings on Floating Rate 15%
CapitaLand Commercial Trust Presentation July 2017
As at 30 June 2017 Assuming +0.5% p.a. increase in interest rate Interest expense +$2.3 million p.a. Annualised 1H 2017 DPU
(0.8% of annualised DPU) Proforma impact on:
21
CapitaLand Commercial Trust Presentation July 2017
Raffles City Singapore
22
CapitaLand Commercial Trust Presentation July 2017
23
Description 51-storey integrated development comprising Grade A office, serviced residence with 299 rooms, ancillary retail and a food centre Use Commercial Height 280m (on par with tallest buildings in Raffles Place) Title Leasehold expiring 31 Jan 2081 (remaining 64 years) Site Area 65,700 sq ft Total GFA 1,005,000 sq ft Office NLA Ancillary retail NLA 635,000 sq ft 12,000 sq ft Serviced residence 299 rooms to be managed by Ascott Food Centre GFA 44,000 sq ft Car Park About 350 lots Target yield on cost 5.0% Estimated Project Development Expenditure S$1.82 billion
CapitaLand Commercial Trust Presentation July 2017
Artist’s impression of new integrated development; target completion in 1H 2021
24
CapitaLand Commercial Trust Presentation July 2017
Notes: (1) Price at market value. The purchase price must be higher than a base price calculated as the total development costs incurred by GOT on the commercial component less any net property income attributable to GOT compounded quarterly at 6.3% p.a.. (2) Price at agreed value. The agreed value must be higher than a base price calculated as the total development costs incurred by GSRT on the SR component less any net property income attributable to GSRT compounded quarterly at 5.0% p.a..
25
April 2017
Announced receipt of provisional permission
13 July 2017
Announced decision to proceed with redevelopment, JV, timeline and project details
31 July 2017
GSCP cessation date
August 2017 to February 2018
Decommissioning and demolition of GSCP
1Q 2018
Commence construction of new development
19 October 2016
Announced intent to redevelop GSCP subject to authorities approval and feasibility study
CapitaLand Commercial Trust Presentation July 2017
Target TOP 1H 2021
26
Artist’s Impressions. Subject to Change. CapitaLand Commercial Trust Presentation July 2017
27
CapitaLand Commercial Trust Presentation July 2017
Raffles City Singapore
Ng Hock How, CapitaLand “Building People” Photography Competition 2012
28 Notes: (1) Source: CBRE Pte. Ltd. (2) Source: URA. URA has not released Occupancy Index Figure for 2Q 2017 (3) Covers Raffles Place, Marina Centre, Shenton Way and Marina Bay, data only available from 3Q 2005 onwards (4) CCT’s interest in One George Street was 100.0% from 1 Jan 2017 to 19 Jun 2017 and 50.0% with effect from 20 Jun 2017
CapitaLand Commercial Trust Presentation July 2017
CCT Committed Occupancy Market Occupancy Level
(1)
2Q 2017 1Q 2017 2Q 2017 1Q 2017 Grade A office 98.9% 98.2% 95.5% 96.6% Portfolio 97.6% 97.8% 94.1% 95.6%
(3) (2)
93.1% 98.3% 99.6% 99.5% 98.8% 96.2% 95.6% 97.7% 96.2% 95.8% 99.4% 98.0% 97.2% 97.6% 82.6% 85.7% 87.7% 92.0% 92.2% 89.2% 87.7% 87.5% 89.1% 91.2% 90.4% 90.2% 90.9% 88.4% 93.1% 97.8% 97.3% 92.3% 93.7% 93.1% 91.6% 95.1% 95.8% 96.2% 95.1% 94.1%
80% 90% 100% 2Q 3Q 4Q 1Q 2Q 3Q 4Q 1Q 2Q 3Q 4Q 1Q 2Q 3Q 4Q 1Q 2Q 3Q 4Q 1Q 2Q 3Q 4Q 1Q 2Q 3Q 4Q 1Q 2Q 3Q 4Q 1Q 2Q 3Q 4Q 1Q 2Q 3Q 4Q 1Q 2Q 3Q 4Q 1Q 2Q 3Q 4Q 1Q 2Q 3Q 4Q 1Q 2Q 2004 2005 2006 2007 2008 2009 2010 2011 2012 2013 2014 2015 2016 2017
CCT's Committed Occupancy Since Inception
CCT URA CBRE's Core CBD Occupancy Rate
29
CapitaLand Commercial Trust Presentation July 2017
Note: (1) Based on net lettable area of new leases committed and using 100% basis for One George Street and Raffles City Singapore
Business sectors of new leases are largely from Banking, Insurance and Financial Services, Real Estate and Property Services; and Legal
(1)
44% 12% 10% 7% 7% 5% 4% 4% 4% 3%
Banking, Insurance and Financial Services Real Estate and Property Services Legal Manufacturing and Distribution Retail Products and Services Business Consultancy, IT, Media and Telecommunications Food and Beverage Government Education and Services Energy, Commodities, Maritime and Logistics
30
Banking, Insurance and Financial Services, 35% Hospitality, 11% Business Consultancy, IT, Media and Telecommunications, 10% Retail Products and Services, 10% Energy, Commodities, Maritime and Logistics, 7% Real Estate and Property Services, 7% Food and Beverage, 6% Manufacturing and Distribution, 5% Education and Services, 4% Legal, 3% Government, 2%
(1)
CapitaLand Commercial Trust Presentation July 2017
Notes: (1) Based on committed monthly gross rental income of tenants as at 30 Jun 2017, including CCT’s 60.0% interest in Raffles City Singapore and 50.0% interest in One George Street; and excluding retail turnover rent (2) CCT’s interest in One George Street was 100.0% from 1 Jan 2017 to 19 Jun 2017 and 50.0% with effect from 20 Jun 2017
Gross Rental Income
Comprising: Banking – 16% Financial Services – 13% Insurance – 6%
31
11% 5% 5% 4% 3% 3% 2% 2% 2% 1%
RC Hotels (Pte) Ltd The Hongkong and Shanghai Banking Corporation Limited GIC Private Limited JPMorgan Chase Bank, N.A. CapitaLand Group Standard Chartered Bank Robinson & Company (Singapore) Private Limited Lloyd's of London (Asia) Pte Ltd Twitter Asia Pacific Pte. Ltd. Economic Development Board
(1)
CapitaLand Commercial Trust Presentation July 2017
Notes: (1) Based on monthly gross rental income of top ten tenants as at 30 Jun 2017, excluding retail turnover rent. Total percentage may not add up due to rounding (2) Based on CCT’s 60.0% interest in Raffles City Singapore (3) CCT’s interest in One George Street was 100.0% from 1 Jan 2017 to 19 Jun 2017 and 50.0% with effect from 20 Jun 2017
(2) (2) (2)
32
2% 11% 25% 15% 11% 11% 1% 4% 7% 4% 0% 0%
9%
2017 2018 2019 2020 2021 2022 and beyond Office Retail Hospitality Completed 8% 3%
CapitaLand Commercial Trust Presentation July 2017
Notes: (1) Excludes retail and hotel turnover rent, as at 30 Jun 2017 (2) WALE: Weighted Average Lease Term to Expiry on committed basis (3) CCT’s interest in One George Street was 100.0% from 1 Jan 2017 to 19 Jun 2017 and 50.0% with effect from 20 Jun 2017
Portfolio WALE
(2) by NLA as at end Jun 2017 = 6.5 years
Lease expiry profile as a percentage of committed monthly gross rental income
(1)
0.8% under advanced negotiation
33
2% 15% 33% 20% 15% 15% 2% 12% 34% 20% 14% 18%
2017 2018 2019 2020 2021 2022 and beyond Monthly Gross Rental Income Committed Net Lettable Area Completed
10% 11%
CapitaLand Commercial Trust Presentation July 2017
Notes: (1) Office lease expiry profile as at 30 Jun 2017 (2) CCT’s interest in One George Street was 100.0% from 1 Jan 2017 to 19 Jun 2017 and 50.0% with effect from 20 Jun 2017
Mitigating office leasing risk by tenant retention and forward renewals
1.1% under advanced negotiation 1.0% under advanced negotiation
34
CapitaLand Commercial Trust Presentation July 2017
Building Average Expired Rents (S$) Committed Rents
(1)
(S$) Sub-Market Market Rents of Comparative Sub-Market (S$) Cushman & Wakefield(2) Knight Frank(3) Six Battery Road 12.37 10.40 – 13.80 Grade A Raffles Place 8.76 9.32 One George Street 9.71 8.65 – 10.40 Grade A Raffles Place 8.76 8.27
Notes: (1) Renewal/new leases committed in 2Q 2017 (2) Source: Cushman & Wakefield 2Q 2017 (3) Source: Knight Frank 1Q 2017; based on leases of a whole floor office space on the mid-floor levels of office properties, and taking into account rent free period and other concessions (4) For reference only: CBRE Pte. Ltd.’s 2Q 2017 Grade A rent is S$8.95 psf per month and they do not publish sub-market rents
35
(1)
CapitaLand Commercial Trust Presentation July 2017
Notes: (1) Average gross rent per month for office portfolio (S$ psf) = Total committed gross rent for office per month Committed area of office per month (2) CCT’s interest in One George Street was 100.0% from 1 Jan 2017 to 19 Jun 2017 and 50.0% with effect from 20 Jun 2017
Committed rents are generally lower than expiring rents
96.8 96.9 94.7 95.3 97.3 98.5 99.3 99.5 99.4 96.4 96.7 97.7 96.0 96.8 97.9 96.9 97.2 96.9 97.6 97.5
7.53 7.64 7.83 7.96 8.03 8.13 8.22 8.23 8.42 8.61 8.78 8.88 8.89 8.90 8.96 8.98 9.22 9.20 9.18 9.18
$4.50 $5.00 $5.50 $6.00 $6.50 $7.00 $7.50 $8.00 $8.50 $9.00 $9.50 9300% 9302% 9304% 9306% 9308% 9310% 9312% 9314% 9316% 9318% 9320% 9322% 9324% 9326% 9328% 9330% 9332% 9334% 9336% 9338% 9340% 9342% 9344% 9346% 9348% 9350% 9352% 9354% 9356% 9358% 9360% 9362% 9364% 9366% 9368% 9370% 9372% 9374% 9376% 9378% 9380% 9382% 9384% 9386% 9388% 9390% 9392% 9394% 9396% 9398% 9400% 9402% 9404% 9406% 9408% 9410% 9412% 9414% 9416% 9418% 9420% 9422% 9424% 9426% 9428% 9430% 9432% 9434% 9436% 9438% 9440% 9442% 9444% 9446% 9448% 9450% 9452% 9454% 9456% 9458% 9460% 9462% 9464% 9466% 9468% 9470% 9472% 9474% 9476% 9478% 9480% 9482% 9484% 9486% 9488% 9490% 9492% 9494% 9496% 9498% 9500% 9502% 9504% 9506% 9508% 9510% 9512% 9514% 9516% 9518% 9520% 9522% 9524% 9526% 9528% 9530% 9532% 9534% 9536% 9538% 9540% 9542% 9544% 9546% 9548% 9550% 9552% 9554% 9556% 9558% 9560% 9562% 9564% 9566% 9568% 9570% 9572% 9574% 9576% 9578% 9580% 9582% 9584% 9586% 9588% 9590% 9592% 9594% 9596% 9598% 9600% 9602% 9604% 9606% 9608% 9610% 9612% 9614% 9616% 9618% 9620% 9622% 9624% 9626% 9628% 9630% 9632% 9634% 9636% 9638% 9640% 9642% 9644% 9646% 9648% 9650% 9652% 9654% 9656% 9658% 9660% 9662% 9664% 9666% 9668% 9670% 9672% 9674% 9676% 9678% 9680% 9682% 9684% 9686% 9688% 9690% 9692% 9694% 9696% 9698% 9700% 9702% 9704% 9706% 9708% 9710% 9712% 9714% 9716% 9718% 9720% 9722% 9724% 9726% 9728% 9730% 9732% 9734% 9736% 9738% 9740% 9742% 9744% 9746% 9748% 9750% 9752% 9754% 9756% 9758% 9760% 9762% 9764% 9766% 9768% 9770% 9772% 9774% 9776% 9778% 9780% 9782% 9784% 9786% 9788% 9790% 9792% 9794% 9796% 9798% 9800% 9802% 9804% 9806% 9808% 9810% 9812% 9814% 9816% 9818% 9820% 9822% 9824% 9826% 9828% 9830% 9832% 9834% 9836% 9838% 9840% 9842% 9844% 9846% 9848% 9850% 9852% 9854% 9856% 9858% 9860% 9862% 9864% 9866% 9868% 9870% 9872% 9874% 9876% 9878% 9880% 9882% 9884% 9886% 9888% 9890% 9892% 9894% 9896% 9898% 9900% 9902% 9904% 9906% 9908% 9910% 9912% 9914% 9916% 9918% 9920% 9922% 9924% 9926% 9928% 9930% 9932% 9934% 9936% 9938% 9940% 9942% 9944% 9946% 9948% 9950% 9952% 9954% 9956% 9958% 9960% 9962% 9964% 9966% 9968% 9970% 9972% 9974% 9976% 9978% 9980% 9982% 9984% 9986% 9988% 9990% 9992% 9994% 9996% 9998% 10000% 10002% 10004% 10006% 10008% 10010% 10012% 10014% 10016% 10018% 10020% 10022% 10024% 10026% 10028% 10030% 10032% 10034% 10036% 10038% 10040% 10042% 10044% 10046% 10048% 10050% 10052% 10054% 10056% 10058% 10060% 10062% 10064% 10066% 10068% 10070% 10072% 10074% 10076% 10078% 10080% 10082% 10084% 10086% 10088% 10090% 10092% 10094% 10096% 10098% 10100% 10102% 10104% 10106% 10108% 10110% 10112% 10114% 10116% 10118% 10120% 10122% 10124% 10126% 10128% 10130% 10132% 10134% 10136% 10138% 10140% 10142% 10144% 10146% 10148% 10150% 10152% 10154% 10156% 10158% 10160% 10162% 10164% 10166% 10168% 10170% 10172% 10174% 10176% 10178% 10180% 10182% 10184% 10186% 10188% 10190% 10192% 10194% 10196% 10198% 10200%
Committed occupancy of office portfolio (%) Average gross rent per month for office portfolio (S$ psf)
36 Monthly gross rental income for leases expiring at respective properties X 100% Monthly gross rental income for office portfolio Average monthly gross rental rate for expiring leases (S$ psf / month)
2Q 2017 Industry Statistics
(1) –
Grade A Office Average Market Rent: S$8.95 psf per month
Notes: (1) Source: CBRE Pte. Ltd. as at 2Q 2017 (2) Four Grade A buildings and Raffles City Tower only (3) CCT’s interest in One George Street was 100.0% from 1 Jan 2017 to 19 Jun 2017 and 50.0% with effect from 20 Jun 2017
CapitaLand Commercial Trust Presentation July 2017
1.0% 0.3% 0.4% 11.15 9.28 10.20 4 8 12 16 20 0% 20% 40% 60% Capital Tower Six Battery Road CapitaGreen One George Street Raffles City Tower
2017 Average rent of leases expiring is S$10.58psf
(2) No leases due No leases due
(3)
37
CapitaLand Commercial Trust Presentation July 2017
Monthly gross rental income for leases expiring at respective properties X 100% Monthly gross rental income for office portfolio Average monthly gross rental rate for expiring leases (S$ psf/month)
Notes: (1) Four Grade A buildings and Raffles City Tower only (2) CCT’s interest in One George Street was 100.0% from 1 Jan 2017 to 19 Jun 2017 and 50.0% with effect from 20 Jun 2017
1.0% 4.6% 3.6% 2.1% 0.7% 8.73 12.42 12.99 9.68 9.92 4
8 12 16 20 0% 20% 40% 60%
Capital Tower Six Battery Road CapitaGreen One George Street Raffles City Tower
2018
Average rent of leases expiring is S$11.45psf
(1)
12.0% of 15.0% leases expiring in 2018 5.7% 6.2% 7.0% 1.3% 2.5% 8.95 11.73 11.36 8.86 8.61 4 8 12 16 20 0% 20% 40% 60%
Capital Tower Six Battery Road CapitaGreen One George Street Raffles City Tower
2019
Average rent of leases expiring is S$10.24psf
(1)
22.7% of 33.0% leases expiring in 2019
38
CapitaLand Commercial Trust Presentation July 2017
Wilkie Edge, Singapore
39 1.3 0.5 0.4 0.4 0.1
0.9
1.3 1.4 1.6 2.2 0.2 0.6 0.3
1.9
2.0 0.8 0.6 0.7 0.6 2.7 0.4
0.8 1.5 1.7 1.4
1.6 1.8 1.4 1.0 0.2 0.3 0.2 0.01
0.0 0.5 1.0 1.5 2.0 2.5 3.0 2000 2001 2002 2003 2004 2005 2006 2007 2008 2009 2010 2011 2012 2013 2014 2015 2016 1Q 2017 2017F 2018F 2019F 2020F 2021F sq ft million Net Supply Net Demand
Notes: (1) Central Area comprises ‘The Downtown Core’, ‘Orchard’ and ‘Rest of Central Area’ (2) Supply is calculated as net change of stock over the quarter and may include office stock removed from market due to conversions or demolitions. (3) Source: Historical data from URA statistics as at 1Q 2017; Forecast supply from CBRE Pte. Ltd. as at 1Q 2017.
Singapore Private Office Space (Central Area) (1) – Net Demand & Supply
Forecast Supply
Periods
Average annual net supply(2) Average annual net demand 2007 – 2016 (through 10-year property market cycles)
0.9 mil sq ft 0.7 mil sq ft
2012 – 2016 (five-year period post GFC)
0.6 mil sq ft 0.6 mil sq ft
2017 – 2021 (forecast gross new supply)
0.9 mil sq ft N.A.
Forecast average annual gross new supply (2017 to 2021): 0.9 mil sq ft
Post-Asian financial crisis, SARs & GFC -weak demand & undersupply
CapitaLand Commercial Trust Presentation July 2017
Redevelopment
40 Notes: (1) Pre-commitment at Marina One is more than one million sq ft according to The Straits Times report dated 7 Feb 2017. Leases have been signed by Swiss private bank Julius Baer, consultancy PwC Singapore, coworking space provider JustCo, agri-business Olam International, social media giant Facebook and Mitsubishi UFJ Financial Group (MUFG). (2) According to marketing agents CBRE and JLL, companies have committed to rent or have submitted leasing proposals for about 30 percent of Frasers Tower’s NLA. Reported in The Straits Times dated 8 Feb 2017. (3) Ascendas-Singbridge’s redevelopment of CPF Building to feature over 500,000 sq ft of Grade A office space, according
to Business Times & Today reports dated 5 Oct 2016. (4) Sources: CBRE Pte. Ltd. and respective media reports
Expected completion Proposed Office Projects Location NLA (sq ft) 2Q 2017 Marina One (about 60%
(1) pre-committed)
Marina Bay 1,876,000 2017 EON Shenton (Strata Office) Shenton Way 101,000 Subtotal (2017): 1,977,000 1Q 2018 Redevelopment of International Factors Building and Robinson Towers Robinson Road 145,000 2Q 2018 Frasers Tower
(2)(20,000 sq ft pre-committed by The Executive Office)
Shenton Way 663,000 Subtotal (2018): 808,000 4Q 2019 Redevelopment of Funan DigitaLife Mall Beach Road/City Hall 204,000 2019 Park Mall Redevelopment Orchard Road 352,000 Subtotal (2019): 556,000 1H 2020 79 Robinson Road (former CPF Building)(3) Robinson Road 500,000 2020 Afro-Asia Building Redevelopment Shenton Way 154,000 Subtotal (2020): 654,000 2021 Redevelopment of Golden Shoe Car Park Raffles Place 635,000 Subtotal (2021 and beyond): 635,000 TOTAL FORECAST SUPPLY (2017-2021 and beyond) 4,630,000 Total forecast supply excluding strata offices 4,529,000
CapitaLand Commercial Trust Presentation July 2017
41
CapitaLand Commercial Trust Presentation July 2017
$0 $2 $4 $6 $8 $10 $12 $14 $16 $18 $20
1Q02 2Q02 3Q02 4Q02 1Q03 2Q03 3Q03 4Q03 1Q04 2Q04 3Q04 4Q04 1Q05 2Q05 3Q05 4Q05 1Q06 2Q06 3Q06 4Q06 1Q07 2Q07 3Q07 4Q07 1Q08 2Q08 3Q08 4Q08 1Q09 2Q09 3Q09 4Q09 1Q10 2Q10 3Q10 4Q10 1Q11 2Q11 3Q11 4Q11 1Q12 2Q12 3Q12 4Q12 1Q13 2Q13 3Q13 4Q13 1Q14 2Q14 3Q14 4Q14 1Q15 2Q15 3Q15 4Q15 1Q16 2Q16 3Q16 4Q16 1Q17 2Q17
S$18.80 S$4.48
S$8.95
Global financial crisis Post-SARs, Dot.com crash
S$8.00
Euro-zone crisis
Monthly gross rent by per square foot S$11.06
2Q 15 3Q 15 4Q 15 1Q 16 2Q 16 3Q 16 4Q 16 1Q 17 2Q 17 Mthly rent (S$ / sq ft ) 11.30 10.90 10.40 9.90 9.50 9.30 9.10 8.95 8.95 % change
0.0%
Source of data: CBRE Pte. Ltd. (figures as at end of each quarter).
S$9.55 S$11.40
42
CapitaLand Commercial Trust Presentation July 2017
Raffles City Singapore
Wong Chow Mein, CapitaLand “Building People” Photography Competition 2012
43
CapitaLand Commercial Trust Presentation July 2017
above Dec 2016 valuation
Sep 2017
Yield-on-cost at 5% p.a.
44
CapitaLand Commercial Trust Presentation July 2017
45
For enquiries, please contact: Ms Ho Mei Peng , Head, Investor Relations & Communications, Direct: (65) 6713 3668 Email: ho.meipeng@capitaland.com CapitaLand Commercial Trust Management Limited (http://www.cct.com.sg) 168 Robinson Road, #28-00 Capital Tower, Singapore 068912 Tel: (65) 6713 2888; Fax: (65) 6713 2999
46
CapitaLand Commercial Trust Presentation July 2017
Raffles City Singapore
Ng Hock How, CapitaLand “Building People” Photography Competition 2012
47
Higher gross revenue contributed by acquisition of 60.0% CapitaGreen
CapitaLand Commercial Trust Presentation July 2017
(1) Notes: (1) Revenue from CapitaGreen was consolidated to CCT Group from September 2016. (2) Revenue from One George Street was for the period 1 Jan 2017 to 19 Jun 2017.
35.2 25.4 11.0 10.2 6.0 6.1 6.9
44.2 35.6 34.4 24.1 11.2 10.2 4.2 6.0 7.1
CapitaGreen Capital Tower Six Battery Road One George Street Twenty Anson HSBC Building Golden Shoe Car Park Bugis Village Wilkie Edge
1H 2016 1H 2017
S$ million
(1) (2)
48
CapitaLand Commercial Trust Presentation July 2017
(1)
Net property income lifted by acquisition of 60.0% CapitaGreen
Notes: (1) Net property income from CapitaGreen was consolidated to CCT Group from September 2016 (2) Net property income from One George Street was for the period 1 Jan 2017 to 19 Jun 2017.
27.0 19.3 8.5 10.2 4.4 4.8 4.9
35.2 26.7 26.9 18.8 8.5 10.2 3.0 4.7 5.0
CapitaGreen Capital Tower Six Battery Road One George Street Twenty Anson HSBC Building Golden Shoe Car Park Bugis Village Wilkie Edge
1H 2016 1H 2017
S$ million
(2) (1)
49
CapitaLand Commercial Trust Presentation July 2017
Notes: (1) Gross revenue and net property income of Raffles City Singapore shown above are based on 100.0%. CCT owns 60.0% interest in Raffles City Singapore. (2) The Hotels have started renovation work in Apr 2017. This renovation is ongoing for a period of three years till 2019.
50
CapitaLand Commercial Trust Presentation July 2017
(1)
CapitaGreen’s strong performance due to higher revenue occupancy
Note: (1) Gross revenue and net property income of CapitaGreen shown above are based on 100.0%. CapitaGreen was a joint venture until CCT acquired the remaining 60.0% interest not owned by CCT on 31 Aug 2016.
(1) (1) 36.3
44.2
100% interest in CapitaGreen
S$ million
Revenue
27.2
35.2
100% interest in CapitaGreen 1H 2016 1H 2017
S$ million
Net Property Income
51
Office, 73% Retail, 16%
(1) contributed by office and
CapitaLand Commercial Trust Presentation July 2017
Notes: (1) Based on gross rental income from 1 Jan 2017 to 30 Jun 2017; including gross rental income from CCT’s 60.0% interest in Raffles City Singapore and corresponding interest in One George Street; and excluding retail turnover rent (2) CCT’s interest in One George Street was 100.0% from 1 Jan 2017 to 19 Jun 2017 and 50.0% with effect from 20 Jun 2017
Mainly from 60% interest in Raffles City Hotels & Convention Centre, 11%
Master lease to hotel operator with about 75% of rent
Gross Rental Income
52 45.1 59.9 78.9 120.4 153.0 198.5 221.0 212.8 228.5 234.2 249.2 254.5 269.0
2004 2005 2006 2007 2008 2009 2010 2011 2012 2013 2014 2015 2016
5.37 6.81 7.33 8.70 11.00 7.06 7.83 7.52 8.04 8.14 8.46 8.62 9.08
2004 2005 2006 2007 2008 2009 2010 2011 2012 2013 2014 2015 2016 Global financial crisis and Euro-zone debt crisis
Global financial crisis and Euro-zone debt crisis Notes: (1) Annualised (2) After taking into consideration the issue of rights units in July 2009 (3) Decline in 2011 DPU compared to 2010 was due to divestment of two properties in 2010, Robinson Point and StarHub Centre
(2) (1) (3)
Distributable Income (S$ million) Distribution Per Unit (cents)
Due to successful portfolio reconstitution strategy including recycling of capital, AEI, acquisition and development
CapitaLand Commercial Trust Presentation July 2017
53
(1) consistently above 90%
CapitaLand Commercial Trust Presentation July 2017
Notes: (1) For years 2004 to 2009, portfolio occupancy rate includes Starhub Centre and Robinson Point which were divested in 2010 (2) CCT’s interest in One George Street was 100.0% from 1 Jan 2017 to 19 Jun 2017 and 50.0% with effect from 20 Jun 2017
2006 2007 2008 2009 2010 2011 2012 2013 2014 2015 2016 1Q 2017 2Q 2017 Capital Tower 100.0 100.0 99.9 99.9 99.9 100.0 100.0 100.0 100.0 94.1 99.0 98.8 99.4 Six Battery Road 100.0 99.9 98.6 99.2 99.7 85.4 93.0 98.6 99.2 98.9 98.6 99.0 98.5 Bugis Village 95.3 99.1 96.6 93.8 93.4 98.8 97.1 97.2 94.8 100.0 97.2 99.1 100.0 Golden Shoe Car Park 98.0 96.4 100.0 100.0 95.2 100.0 100.0 94.6 100.0 97.3 72.4 73.7 63.8 HSBC Building 100.0 100.0 100.0 100.0 100.0 100.0 100.0 100.0 100.0 100.0 100.0 100.0 100.0
Raffles City (60% interest)
99.5 99.3 99.9 99.3 99.1 98.9 100.0 100.0 100.0 99.2 97.8 98.3 98.7 Wilkie Edge 52.5 77.9 98.4 98.4 93.9 99.6 100.0 100.0 99.6 99.9 99.4 One George Street (50% interest)(2) 100.0 96.3 100.0 93.3 92.5 95.5 100.0 98.2 96.5 96.5 97.5 Twenty Anson 100.0 98.1 97.8 97.9 91.7 93.0 84.2 CapitaGreen 69.3 91.3 95.9 98.2 99.0
Portfolio Occupancy
99.6 99.6 96.2 94.8 99.3 95.8 97.2 98.7 96.8 97.1 97.1 97.8 97.6
54
# Market Capitalisation as at 19 Jul 2017
* Deposited Properties as at 30 Jun 2017 Wilkie Edge Golden Shoe Car Park
Properties in Singapore’s Central Area
Deposited Properties
Market Capitalisation
Owned by CapitaLand Group
Capital Tower
One George Street (50% stake)
Raffles City Singapore (60% stake) Twenty Anson CapitaGreen Six Battery Road HSBC Building Bugis Village
CapitaLand Commercial Trust Presentation July 2017
55
1 3 4
1. Capital Tower 2. CapitaGreen 3. Six Battery Road 4. One George Street (50.0% interest) 5. Raffles City Singapore (60.0% interest) 6. Twenty Anson 7. HSBC Building 8. Wilkie Edge 9. Bugis Village
Car Park
5 6 8 9 7 10
CapitaLand Commercial Trust Presentation July 2017
2
56
2005: Acquired HSBC Building 2006: Acquired 60.0% interest in RCS Trust which owns Raffles City Singapore 2010: Sale of Robinson Point and StarHub Centre 2011: Entered JV to redevelop Market Street Car Park into CapitaGreen CCT owns 40.0% interest in CapitaGreen 2012: Acquired Twenty Anson 2008: Acquired Wilkie Edge and One George Street 2012 - 2014: Raffles City Tower AEI 2013 - 2015: Capital Tower AEI 2007 - 2010: Raffles City Singapore AEIs 31 Aug 2016: Acquired remaining 60.0% interest in CapitaGreen
Sale of One George Street to LLP and own 50% interest thereafter
Sale of Wilkie Edge (not completed)
TOP on 18 Dec 2014
2010 – 2013 Six Battery Road AEI 13 Jul 2017: Entered JV to redevelop Golden Shoe Car Park CCT owns 45.0% interest in JV
57
CapitaLand Commercial Trust Presentation July 2017
Capital Tower CapitaGreen Six Battery Road One George Street Raffles City Singapore (100%) Address 168 Robinson Road 138 Market Street 6 Battery Road 1 George Street 250/252 North Bridge Road; 2 Stamford Road; 80 Bras Basah Road NLA (sq ft) 738,000 702,000 495,000 446,000 805,000 (Office: 381,000, Retail: 424,000) Leasehold expiring 31-Dec-2094 31-Mar-2073 19-Apr-2825 21-Jan-2102 15-Jul-2078 Committed
99.4% 99.0% 98.5% 97.5% 98.7% Valuation (30 Jun 2017) S$1,361.0m S$1,616.0m S$1,401.0m S$1,116.2m(100.0%) S$558.1m (50.0%) S$3,250.0m (100.0%) S$1,950.0m (60.0%) Car park lots 415 180 190 178 1,045
58
CapitaLand Commercial Trust Presentation July 2017
Twenty Anson HSBC Building Wilkie Edge(1) Bugis Village(2) Golden Shoe Car Park(3) Address 20 Anson Road 21 Collyer Quay 8 Wilkie Road 62 to 67 Queen Street, 151 to 166 Rochor Road, 229 to 253 (odd nos
Street 50 Market Street NLA (sq ft) 207,000 200,000 155,000 121,000 47,000 Leasehold expiring 22-Nov-2106 18-Dec-2849 20-Feb-2105 30-Mar-2088 31-Jan-2081 Committed
84.2% 100.0% 99.4% 100.0% 63.8% Valuation (30 Jun 2017) S$433.0 m S$456.0m S$205.0m S$47.0m S$141.0m Car park lots 55 55 215 NA 1,053
Notes: (1) CCT entered into a sale and purchase agreement for the sale of Wilkie Edge on 3 July 2017. (2) The leasehold title and the valuation take into account the right of the President of the Republic of Singapore, as Lessor under the State Lease, to terminate the State Lease on 1 Apr 2019 upon payment of S$6,610,208.53 plus accrued interest. (3) CapitaLand, CCT and MEC have formed a joint venture to redevelop Golden Shoe Car Park as per announcement dated 13 July 2017.