
SLIDE 1
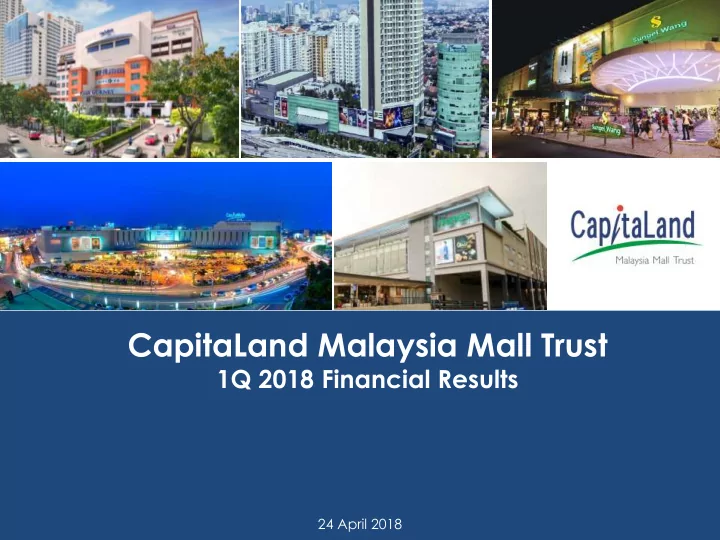
1 CapitaLand Malaysia Mall Trust 1Q 2018 Financial Results 24 April 2018
24 April 2018
CapitaLand Malaysia Mall Trust 1Q 2018 Financial Results 24 April - - PowerPoint PPT Presentation
CapitaLand Malaysia Mall Trust 1Q 2018 Financial Results 24 April 2018 1 CapitaLand Malaysia Mall Trust 1Q 2018 Financial Results 24 April 2018 Disclaimer These materials may contain forward-looking statements that involve assumptions, risks
1 CapitaLand Malaysia Mall Trust 1Q 2018 Financial Results 24 April 2018
24 April 2018
2 CapitaLand Malaysia Mall Trust 1Q 2018 Financial Results 24 April 2018
These materials may contain forward-looking statements that involve assumptions, risks and uncertainties. Actual future performance, outcomes and results may differ materially from those expressed in forward-looking statements as a result of a number of risks, uncertainties and assumptions. Representative examples of these factors include (without limitation) general industry and economic conditions, interest rate trends, cost of capital and capital availability, competition from other developments, shifts in expected levels of property rental income, changes in
and public policy changes. You are cautioned not to place undue reliance on these forward-looking statements, which are based on the current view of management on future events. The information contained in these materials has not been independently verified. No representation or warranty expressed or implied is made as to, and no reliance should be placed on, the fairness, accuracy, completeness or correctness of the information or opinions contained in these materials. Neither CapitaLand Malaysia Mall REIT Management Sdn. Bhd. (the Manager) or any of its affiliates, advisers or representatives shall have any liability whatsoever (in negligence or otherwise) for any loss howsoever arising, whether directly, from any use, reliance or distribution of these materials or its contents or otherwise arising in connection with these materials. The past performance of CMMT is not indicative of the future performance of CMMT. Similarly, the past performance
The value of units in CMMT (Units) and the income derived from them may fall as well as rise. Units are not obligations
risks, including the possible loss of the principal amount invested. It is intended that holders of Units may only deal in their Units through trading on Bursa Securities. Listing of the Units on Bursa Securities does not guarantee a liquid market for the Units. These materials are for information only and does not constitute an invitation or offer to acquire, purchase or subscribe for Units.
3 CapitaLand Malaysia Mall Trust 1Q 2018 Financial Results 24 April 2018
4 CapitaLand Malaysia Mall Trust 1Q 2018 Financial Results 24 April 2018
Gurney Plaza, Penang, Malaysia
5 CapitaLand Malaysia Mall Trust 1Q 2018 Financial Results 24 April 2018
1. Made up of Sungei Wang, Tropicana City Property and The Mines
6 CapitaLand Malaysia Mall Trust 1Q 2018 Financial Results 24 April 2018
7 CapitaLand Malaysia Mall Trust 1Q 2018 Financial Results 24 April 2018
Sungei Wang Plaza, Kuala Lumpur, Malaysia
8 CapitaLand Malaysia Mall Trust 1Q 2018 Financial Results 24 April 2018
1 The difference between distributable income and income available for distribution is due to rollover adjustment for
rounding effect of DPU.
1Q 2018 1Q 2017 Actual Actual Change RM'000 (Unaudited) (Unaudited) % Gross revenue 89,733 92,444 (2.9) Less: Property operating expenses (32,688) (32,728) (0.1) Net property income 57,045 59,716 (4.5) Interest income 1,292 1,413 (8.6) Net investment income 58,337 61,129 (4.6) Manager’s management fee (5,664) (5,773) (1.9) Trust and other expenses (462) (456) 1.3 Finance costs (14,958) (14,660) 2.0 Profit before taxation 37,253 40,240 (7.4) Taxation
37,253 40,240 (7.4) Distribution adjustments 4,110 2,133 92.7 Income available for distribution 41,363 42,373 (2.4) Distributable income1 41,221 42,320 (2.6) DPU (sen) 2.02 2.08 (2.9)
9 CapitaLand Malaysia Mall Trust 1Q 2018 Financial Results 24 April 2018
1
1 Tropicana City Property consists of Tropicana City Mall and Tropicana City Office Tower
Mainly due to:
Plaza (GP) and East Coast Mall; and
termination of a mini anchor tenant at Sungei Wang (SW). Offset by:
at SW;
Property.
10 CapitaLand Malaysia Mall Trust 1Q 2018 Financial Results 24 April 2018
Mainly due to:
SW. Offset by:
assessment fees for prior years at GP.
11 CapitaLand Malaysia Mall Trust 1Q 2018 Financial Results 24 April 2018
12 CapitaLand Malaysia Mall Trust 1Q 2018 Financial Results 24 April 2018
1Q 2018 1Q 2017 Actual Actual Change (Unaudited) (Unaudited) % Distributable Income (RM'000) 41,221 42,320 (2.6) DPU (sen) 2.02 2.08 (2.9) DPU (sen) - annualised 8.19 8.44 (3.0) Distribution yield (%) 7.58 5.18 N.M.
(Based on market price of RM1.08 on 30 March 2018 and RM1.63 on 31 March 2017)
Distribution yield (%) 7.12 5.28 N.M.
(Based on market price of RM1.15 on 23 April 2018 and RM1.60 on 17 April 2017)
N.M. – Not meaningful
13 CapitaLand Malaysia Mall Trust 1Q 2018 Financial Results 24 April 2018
Term Loan facilities Unrated Medium Term Notes Revolving Credit facilities
14 CapitaLand Malaysia Mall Trust 1Q 2018 Financial Results 24 April 2018
1Q 2018 4Q 2017 Unencumbered assets as % of total assets 29.7% 29.7% Gearing ratio 32.9% 32.8% Average cost of debt 4.44% 4.41% Fixed:Floating rate debt ratio 85%:15% 80%:20% Net debt / EBITDA (times) 6.5 6.5 Interest coverage (times) 3.5 3.5 Average term to maturity (years) 5.6 5.7
15 CapitaLand Malaysia Mall Trust 1Q 2018 Financial Results 24 April 2018
As at 31 March 2018 RM'mil Non-current Assets 3,969 Current Assets 165 Total Assets 4,134 Current Liabilities 165 Non-current Liabilities 1,323 Total Liabilities 1,488 Net Assets 2,646 Total Unitholders' Funds 2,646 Number of Units in Circulation (in million units) 2,041 NAV (RM'mil)
2,646
2,605 NAV per unit (RM)
1.30
1.28
16 CapitaLand Malaysia Mall Trust 1Q 2018 Financial Results 24 April 2018
The Mines, Selangor, Malaysia
17 CapitaLand Malaysia Mall Trust 1Q 2018 Financial Results 24 April 2018
1. Excluding newly created and reconfigured units. 2. Excluding gross turnover rent component. 3. Majority of leases have rental escalation clause. 4. The % is computed based on the increase in the 1st year rental of the renewed term over last year rental of the preceding term.
From 1 January 2018 to 31 March 2018
1
leases/renewals
(%) Gurney Plaza 45 +4.6 East Coast Mall 12 +1.5 The Mines 12 +0.1 Tropicana City Mall 10
CMMT Portfolio (Excluding Sungei Wang) 79 +2.6 Sungei Wang 8
CMMT Portfolio (Retail) 87 +2.2 Tropicana City Office Tower 0.0 CMMT Portfolio (Retail + Office) 87 +2.2
18 CapitaLand Malaysia Mall Trust 1Q 2018 Financial Results 24 April 2018
As at 31 March 2018 CMMT (Retail) No of Leases1 Gross Rental Income RM’000 % of Total Gross Rental Income2 2018 585 8,095 36.6% 2019 366 6,228 28.2% 2020 296 6,691 30.3% Beyond 2020 63 1,080 4.9% As at 31 March 2018 CMMT (Office) No of Leases1 Gross Rental Income RM’000 % of Total Gross Rental Income3 2018 2 283 64.6% 2019 2 109 25.0% 2021 1 46 10.4%
1. Based on all committed leases as at 31 March 2018. 2. Based on committed gross rental income for CMMT (Retail) as at 31 March 2018. 3. Based on committed gross rental income for CMMT (Office) as at 31 March 2018.
19 CapitaLand Malaysia Mall Trust 1Q 2018 Financial Results 24 April 2018
As at 31 March 2018
Net Lettable Area (“NLA”) Gross Rental Income (“GRI”) Sq ft % of Total NLA1 RM’000 % of Total GRI1 Gurney Plaza 138 160,042 5.5% 2,328 10.3% East Coast Mall 68 103,891 3.6% 1,021 4.5% The Mines 157 401,758 13.9% 2,502 11.1% Tropicana City Mall 95 178,135 6.2% 1,286 5.7% Sungei Wang 127 241,377 8.3% 958 4.3% CMMT (Retail) 585 1,085,203 37.5% 8,095 35.9% Tropicana City Office Tower 2 68,960 2.4% 283 1.3% CMMT Portfolio (Retail & Office) 587 1,154,163 39.9% 8,378 37.2%
1. Based on committed leases for CMMT Portfolio(Retail + Office) as at 31 March 2018.
20 CapitaLand Malaysia Mall Trust 1Q 2018 Financial Results 24 April 2018
4Q 2017 1Q 2018 31 December 171 31 March 181 Gurney Plaza 99.4% 98.9% East Coast Mall 98.9% 98.8% The Mines 94.4% 94.8% Tropicana City Mall2 92.6% 90.2% Sungei Wang 90.1% 80.0% CMMT (Retail) 95.7% 93.7% Tropicana City Office Tower2 86.7% 95.2% CMMT Portfolio (Retail & Office) 95.4% 93.7%
1. Based on committed leases. 2. The occupancy of Tropicana City Property is 91.1% as at 31 March 2018.
21 CapitaLand Malaysia Mall Trust 1Q 2018 Financial Results 24 April 2018
14,623 14,498
10,000 11,000 12,000 13,000 14,000 15,000
1Q'17 1Q'18
Shopper Traffic ('000)
2,193 2,130
100 600 1,100 1,600 2,100 2,600
1Q'17 1Q'18
Vehicular Traffic ('000)
22 CapitaLand Malaysia Mall Trust 1Q 2018 Financial Results 24 April 2018
East Coast Mall, Kuantan, Malaysia
23 CapitaLand Malaysia Mall Trust 1Q 2018 Financial Results 24 April 2018
commenced operations at Tropicana City Mall’s Level 2.
24 CapitaLand Malaysia Mall Trust 1Q 2018 Financial Results 24 April 2018
Gurney Plaza
FURLA MOONSHOT SQUID BOY AWA MEE BAR YOSHINOYA JAPANESE KITCHEN
East Coast Mall The Mines
THE ROLLZ
25 CapitaLand Malaysia Mall Trust 1Q 2018 Financial Results 24 April 2018
KOONG WOH TONG CREAM BEAR
Gurney Plaza
UNIVERSAL TRAVELLER VANS
East Coast Mall The Mines
OPPO SAMSUNG
26 CapitaLand Malaysia Mall Trust 1Q 2018 Financial Results 24 April 2018
Tropicana City Mall Sungei Wang
BOOST JUICE ACE HARDWARE MUSE BY WATSON
27 CapitaLand Malaysia Mall Trust 1Q 2018 Financial Results 24 April 2018
MEDIA BRIEFING AT JUMPA SHOWSUITE NEW JUMPA SHOWSUITE IN SUNGEI WANG TO SUPPORT LEASING EFFORTS JUMPA FAÇADE
28 CapitaLand Malaysia Mall Trust 1Q 2018 Financial Results 24 April 2018
29 CapitaLand Malaysia Mall Trust 1Q 2018 Financial Results 24 April 2018
charity initiative – Grow 2018 in March.
children and shoppers to grow plants using hydroponic method in the green house.
be donated to a selected charitable organisation.
30 CapitaLand Malaysia Mall Trust 1Q 2018 Financial Results 24 April 2018
GURNEY PLAZA – LION DANCE PERFORMANCE
THE MINES – GOLDEN TREE WITH SLIDE TROPICANA CITY MALL – TOSSING YEE SANG EAST COAST MALL – ACROBATIC LION DANCE
31 CapitaLand Malaysia Mall Trust 1Q 2018 Financial Results 24 April 2018
THE MINES – CYCLING CHALLENGE GURNEY PLAZA – RECYCLING PROGRAMME EAST COAST MALL – RECYCLING WORKSHOP
32 CapitaLand Malaysia Mall Trust 1Q 2018 Financial Results 24 April 2018
Plaza was among the finalists for Malaysia Tourism Awards 2016/2017 (Best Shopping Centre – Stand-alone Shopping Centre category).
Coast Mall received a certificate
appreciation in conjunction with Visit Pahang 2017 from Tourism Pahang.
Certificate of Appreciation in conjunction with Visit Pahang 2017 Malaysia Tourism Awards 2016/2017 (Best Shopping Centre – Stand-alone Shopping Centre) – Certificate of Merit
33 CapitaLand Malaysia Mall Trust 1Q 2018 Financial Results 24 April 2018
For enquiries, please contact: Jasmine Loo (Investor Relations) Tel: +60 3 2279 9873 Fax: +60 3 2279 9889 Email: jasmine.loo@capitaland.com www.cmmt.com.my